Keyword search
My Report
Dear Stakeholder,
We extend our heartfelt appreciation to our steadfast investors who have chosen to invest in both the equity and the debt of our Bank. Rest assured, we are dedicated to maximising returns on your investments through careful and sustainable growth. It is our responsibility to offer you a comprehensive and balanced perspective of the Bank’s performance, including operational results, financial standing and cash flows, enabling you to make informed decisions. As one of Sri Lanka’s four Domestic Systemically Important Banks (D-SIBs) and the largest private sector Bank, designated as such by the Central Bank of Sri Lanka, we are confident in our ability to meet your expectations despite the challenges presented by the operating environment, mostly due to or caused by factors that flowed from the previous years. We commit to fulfilling our obligations in the best interests of our investors and believe that the information provided in this Integrated Report and Financial Statements will enhance your understanding of our core strengths, thereby fostering trust and loyalty among our investor community, who share a long-term vision of sustainable value creation.
The Bank is committed to nurturing robust and reciprocal communication channels with our esteemed investors, cultivating mutual trust and confidence. We uphold the rights granted to investors by relevant statutes to address material concerns, as elaborated in the "Connecting with Stakeholders" section on pages 38 to 41. These efforts have enabled us to engage proactively with our investors in a consistent, thorough and meaningful manner, often surpassing legal obligations and enhancing our reputation.
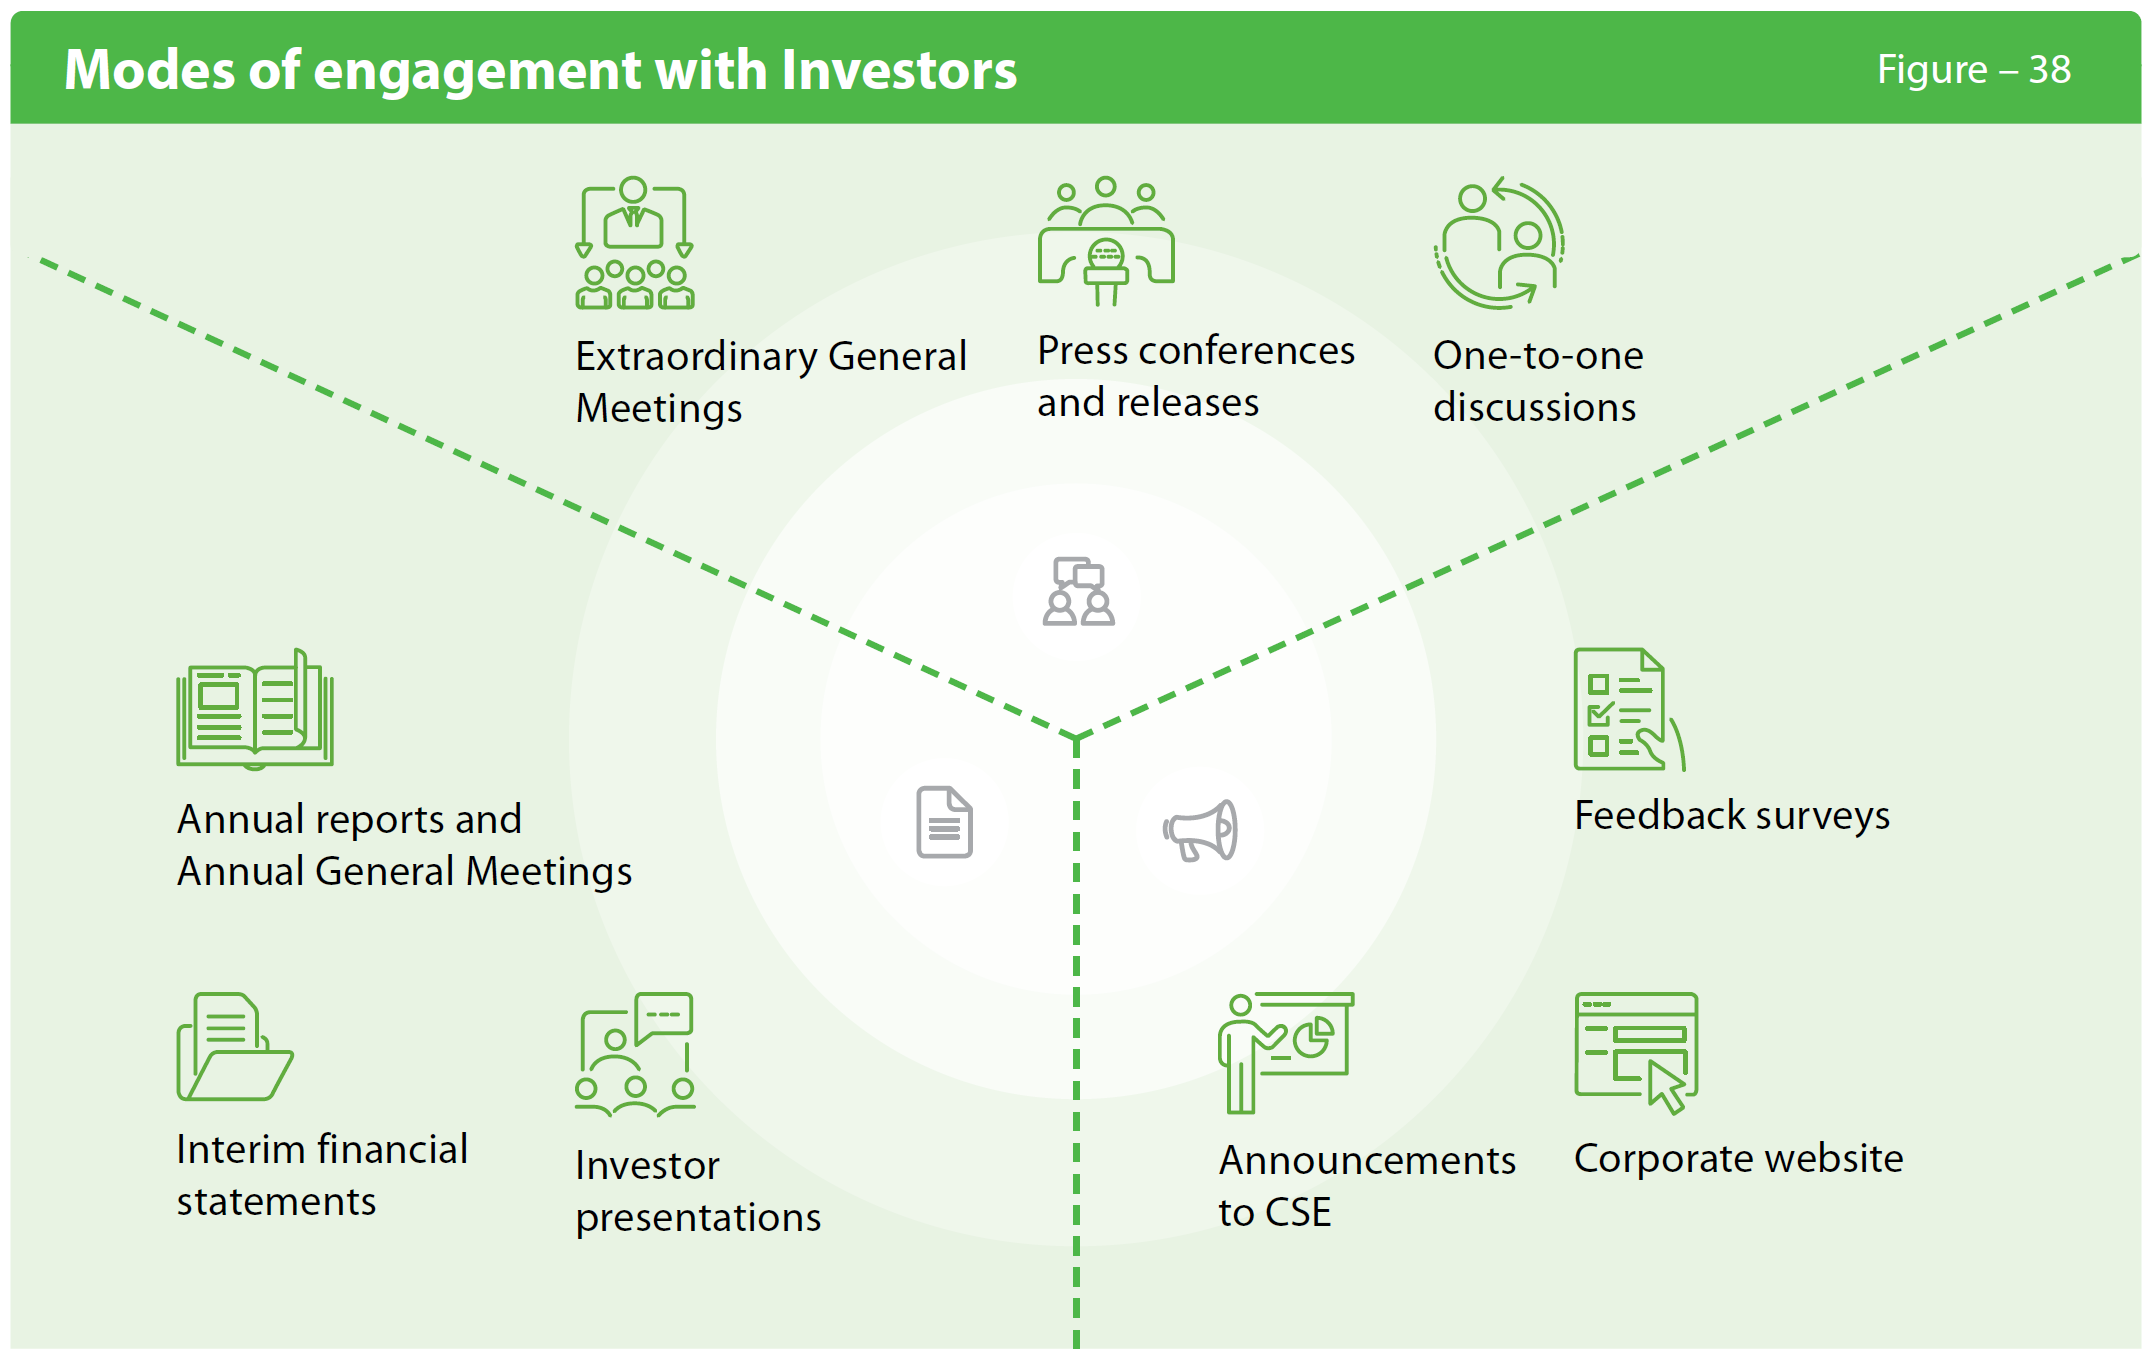
The Bank employs a diverse array of methods to engage and interact with its stakeholders. This encompasses the Annual Report, serving as the primary tool for investor communication, along with Annual General Meetings and Extra-Ordinary General Meetings, convened as necessary to provide opportunities for the investor community to connect with the Bank. Consistent with past practices, the Bank has produced an integrated Annual Report this year, presented in a concise format across each section. We deeply value the insightful feedback provided by our shareholders in previous surveys and comments, which has been carefully considered. To further enhance our reporting, we have included a stakeholder feedback form in this year’s Annual Report, inviting your valuable suggestions and opinions. Your feedback is invaluable to us and we are committed to incorporating it into our strategies to create long-term value for all stakeholders. We believe that these interactions will provide investors with valuable insights into the Bank’s performance, strategic direction, governance mechanisms, risk management strategies and the Sustainability Framework.
The investor relations section of our website which can be found at https://www.combank.lk/investors is another popular channel available for stakeholders, where both a PDF and an interactive version of the Bank’s Annual Report have been hosted. The Bank makes sure that its pages are regularly updated along with the rest of the site’s content.
We firmly believe that the Bank’s efforts to have an effective communication and active engagement with important stakeholder groups have made the Bank’s shares a creditable investment proposition, despite multitude of global and local developments detailed in Our Operating Context and Outlook.

Performance of the Colombo Stock Exchange (CSE) in 2023
Contrary to the year 2022 which had a notable decline in the performance of the CSE primarily due to effect of COVID-19, followed by the social unrest and the unstable political environment, the year 2023 saw the main index of the CSE, All Share Price Index (ASPI) becoming one of the world‘s top-performing stock market index. ASPI which stood at 8,490 points by the end of 2022, improved by 2,164 points to 10,654 points by the end of 2023, recording a growth of 25.50%. In the meantime, the S&P SL20 index, following the ASPI, improved to 3,068 points by the end of 2023, from 2,636 points at the end of 2022, recording an improvement of 432 points or 16.42%. Consequently, the market capitalisation which was at Rs. 3.847 Tn. at the end of 2022 too increased to Rs. 4.249 Tn. at the end of 2023, with a notable improvement of 10.44%.
Performance of the Banking Sector and Commercial Bank shares in 2023
In the backdrop of the excellent performance of the ASPI and the S&P SL20 indices during 2023, as shown in the above graph, the banking sector shares displayed a superior performance with the Bank index improving to 797 points at the end of 2023 compared to 386 points at the end 2022, with a commendable growth of 106.64%. It is pertinent to mention that the share prices of both voting and non-voting ordinary shares improved significantly by 90.24% and 94.67% respectively, during the year 2023, with the market prices of ordinary voting shares and ordinary non-voting shares closing Rs. 95.50 and Rs. 80.40 (Rs. 50.20 and Rs. 41.30 at end of 2022) respectively, as shown in the Table 29 on page 149. However, the share price of the Bank’s ordinary voting shares traded at a discount to its book value at 0.58 times at the end of 2023 (0.31 times at the end of 2022). Nevertheless, it continued to remain the highest among its peers in the Banking Sector.
As at December 31, 2023, the Bank’s public holding (free float) was 99.81% in ordinary voting shares (99.81% in 2022) and 99.88% in ordinary non-voting shares (99.88% in 2022), while its float-adjusted market capitalisation (compliant under option-1 of the Rules on minimum public holding requirement of the CSE) improved to Rs.124.095 Bn. from Rs. 61.476 Bn. in 2022 by 101.86%. As shown in Tables 32 and 33 on page 150, both voting and ordinary non-voting shares of the Bank were actively traded in the CSE where the investors are given a convenient “enter and exit” mechanism with the number of share transactions in the CSE recorded a notable improvement while the number of shares traded in the CSE by the two categories of shares reflected mixed results. In the meantime, the number of shareholders holding both voting and non-voting shares of the Bank at the end of the year stood at 15,857 and 5,702 respectively, as depicted in Table 35 showing the confidence placed by investors in the Bank’s shares.
Compliance report on the contents of the Annual Report in terms of the Listing Rules of the CSE
We are pleased to inform you that the Bank has fully complied with all relevant provisions of Section 7.6 of the Listing Rules of the CSE regarding the information to be included in an entity’s Annual Report and Financial Statements.
Table 25 given below provides a complete list of disclosure requirements and references to the relevant sections of this Annual Report where the Bank’s compliance with the required disclosures are made together with the relevant page numbers.
The pages that follow contain information on the performance of the Bank’s listed securities.
Compliance with requirements of the Section 7.6 of the Listing Rules of the CSE
Table – 25| Rule No. | Disclosure requirement | Section/reference |
| 7.6 (i) | Names of Directors during the financial year and their profiles. | Governance and Risk Management |
| 7.6 (ii) | Principal activities of the Bank and its subsidiaries during the year and any changes therein. |
Note 1.3 to the Financial Statements Group Structure |
| 7.6 (iii) | Names and the number of shares held by the 20 largest holders of voting and non-voting ordinary shares and the percentage of such shares held. |
Item 4.2 of the “Investor Relations” |
| 7.6 (iv) (a) | The float adjusted market capitalisation, public holding percentage (%), number of public shareholders and under which option the Bank complies with the minimum public holding requirement, in respect of voting ordinary shares. The public holding percentage (%) in respect of non-voting ordinary shares. | Item 4.3 of the “Investor Relations” |
| 7.6 (iv) (b) | Public holding percentage (%) and the number of public shareholders of foreign currency denominated shares. | The Bank has not issued any foreign currency denominated shares |
| 7.6 (v) | Details of each Director’s and Chief Executive Officer’s holding in each class of shares of the Bank at the beginning and end of the financial year. | Item 4.4 of the “Investor Relations” |
| 7.6 (vi) | Information pertaining to material foreseeable risk factors of the Bank. | Item 5 of the “Investor Relations” |
| 7.6 (vii) | Details of material issues pertaining to employees and industrial relations of the Bank. | Item 6 of the “Investor Relations” |
| 7.6 (viii) | Extents, locations, valuations and the number of buildings of the Bank’s land holdings and investment properties. | Note 38.5 (a) and (b) to the Financial Statements |
| 7.6 (ix) | Number of shares representing the Bank’s stated capital. | Note 51 to the Financial Statements Item 7 of the “Investor Relations” |
| 7.6 (x) | A distribution schedule of the number of holders in each class of equity securities and the percentage of their total holdings as at the end of the year. | Item 4.5 of the “Investor Relations” |
| 7.6 (xi) | Ratios and market price information: Equity – Dividend per share, dividend payout ratio, net asset value per share, market value per share – highest, lowest values recorded during the financial year and the market value as at the end of the financial year. Debt – Interest rate of comparable Government Securities, debt/equity ratio, interest cover and quick asset ratio, Debt Service Coverage ratio, market prices and yield during the year – High, low and last traded prices.
Any changes in credit rating (for the Bank or any other instrument issued by the Bank). |
Financial Highlights Items 2, 3 and 11 of the “Investor Relations” Items 10 and 11 of the “Investor Relations” Item 12 of the “Investor Relations” |
| 7.6 (xii) | Significant changes in the Bank’s or its subsidiaries’ fixed assets including substantial difference between market value and book value of lands. | Note 38.5 (b) to the Financial Statements |
| 7.6 (xiii) | Details of funds raised through Initial Public Offering and/or a further issue of Securities during the year.
is published first. |
Note 51 and 51.1 to the Financial Statements The Bank did not raise funds through a share issue during the year Note 50 to the Financial Statements for the details of debentures issued during the year Item 10 of the “Investor Relations” |
| 7.6 (xiv) | (a) Information in respect of Employee Share Option Schemes
|
Note 52.1 to the Financial Statements “Employee Share Option Plans” Item 24 of the Statement of Compliance |
(b) Information in respect of Employee Share Purchase Schemes (ESPS).
|
Not applicable as the Bank does not have Employee Share Purchase Schemes |
|
| 7.6 (xv) | Disclosures pertaining to Corporate Governance practices in terms of Section 9 of the Rules. | Required disclosures are given in Annexure 1.3 “Compliance with Section 9 of the Listing Rules issued by the Colombo Stock Exchange” |
| 7.6 (xvi) | Related party transactions exceeding 10% of the equity or 5% of the total assets of the Bank as per Audited Financial Statements, whichever is lower. | The Bank did not have any related party transactions exceeding this threshold during the year 2023 and as at end 2023 (Note 62.6 to the Financial Statements) |
| Details of investments in a related party and/or amounts due from a related party to be set out separately. | ||
The details shall include, as a minimum:
|
Item 20.3 of the Statement of Compliance |
|
| 7.6 (xvii) | Disclosures on foreign currency denominated securities listed on the CSE | The Bank has not issued foreign currency denominated securities |
| 7.6 (xviii) | Disclosures on the Sustainable Bonds listed on the CSE | The Bank has not issued Sustainable Bonds |
| 7.6 (xix) | Disclosures on Perpetual Debt Securities listed on the CSE | The Bank has not issued any Perpetual Debt Securities |
1. Listed Securities of the Bank
The Bank’s ordinary shares (both voting and non-voting) are listed on the Main Board of the CSE under the ticker symbol “COMB”. All debentures issued are also listed on the CSE. (Table 26 on page 148 for a summary of listed securities of the Bank).
The Business section of most daily newspapers, including the Daily News, Daily FT, The Island and Daily Mirror carry a summary of trading activity and the daily prices of shares and debentures traded (if any) using the abbreviation of Commercial Bank or COMB.
Summary of listed securities of the Bank
Table – 26| NUMBER IN ISSUE AS AT | Security code/ID | ||
| December 31, 2023 | December 31, 2022 | ||
| Equity | |||
| Ordinary shares – Voting | 1,236,525,395 | 1,167,236,442 | COMB-N0000 |
| Ordinary shares – Non-voting | 77,595,733 | 72,541,605 | COMB-X0000 |
| Debt | |||
| Fixed rate Debentures March 2016/26 | 17,490,900 | 17,490,900 | COMB-BD-08/03/26-C2342-11.25% |
| Fixed rate Debentures October 2016/26 | 19,282,000 | 19,282,000 | COMB-BD-27/10/26-C2359-12.25% |
| Fixed rate Debentures July 2018/23 | – | 83,938,400 | COMB-BD-22/07/23-C2404-12.00% |
| Fixed rate Debentures July 2018/28 | 16,061,600 | 16,061,600 | COMB-BD-22/07/28-C2405-12.50% |
| Fixed rate Debentures September 2021/26 | 42,374,700 | 42,374,700 | COMB-BD-20/09/26-C2491-09.00% |
| Fixed rate Debentures September 2021/28 | 43,580,000 | 43,580,000 | COMB-BD-20/09/28-C2492-09.50% |
| Fixed rate Debentures December 2022/27 | 67,246,800 | 67,246,800 | COMB-BD-11/12/27-C2504-28.00% |
| Fixed rate Debentures December 2022/29 | 32,638,200 | 32,638,200 | COMB-BD-11/12/29-C2503-27.00% |
| Fixed rate Debentures December 2022/32 | 115,000 | 115,000 | COMB-BD-11/12/32-C2505-22.00% |
| Fixed rate Debentures December 2023/28 | 21,324,000 | Issued during the year 2023 | COMB-BD-19/12/28-C2516-14.50% |
| Fixed rate Debentures December 2023/28 | 75,580,900 | COMB-BD-19/12/28-C2517-15.00% | |
| Fixed rate Debentures December 2023/30 | 329,800 | COMB-BD-19/12/30-C2519-13.75% | |
| Fixed rate Debentures December 2023/30 | 8,177,600 | COMB-BD-19/12/30-C2521-14.25% | |
| Fixed rate Debentures December 2023/33 | 308,400 | COMB-BD-19/12/33-C2518-13.50% | |
| Fixed rate Debentures December 2023/33 | 14,279,300 | COMB-BD-19/12/33-C2520-14.00% | |
Equity securities Features of ordinary shares
Table – 27| Security type | Quoted ordinary shares |
| Listed exchange | Colombo Stock Exchange (CSE) – Main Board |
| Featured stock indices | All Share Price Index (ASPI) |
| Standard & Poor’s Sri Lanka 20 (S&P SL20) | |
| GICS Industry Group | Banks |
| CSE stock symbol | Voting – COMB.N0000 |
| Non-Voting – COMB.X0000 | |
| International Securities Identification Number (ISIN) |
Voting – LK0053N00005 |
| Non-Voting – LK0053X00004 |
2. Performance of COMB shares and returns to shareholders
The investor interest in the Bank’s shares persisted during the year 2023 compared to 2022 as evidenced by the increased number of share transactions (Table 32 on page 150) and the number of shares traded (Table 33 on page 150) despite a slight drop in the number of shareholders in both categories of ordinary Voting and Non-Voting shares (Table 35 on page 152).
The market price of an ordinary voting share of the Bank recorded a significant increase of 90.24% (as opposed to drop of 36.70% in 2022) to Rs. 95.50 at the end of 2023 from Rs. 50.20 at the end of 2022 while the market price of an ordinary non-voting share of the Bank too recorded an appreciable improvement of 94.67% (as opposed to drop of 42.64% in 2022) to Rs. 80.40 at the end of 2023 from Rs. 41.30 at the end of 2022 (Table 29 on page 149). During most of 2023, the movement of the prices of non-voting shares followed the trend of the voting shares. The Bank continued with its policy of issuing scrip dividends and Employee Share Option Plans. Market capitalisation in terms of Rupees for both voting and non-voting shares stood at Rs. 124.327 Bn. (USD 383.429 Mn.) at end of 2023 compared to Rs. 61.591 Bn. (USD 167.824 Mn.) at end of 2022 which accounted for 2.93% of the total market capitalisation of the CSE of Rs. 4.249 Tn. as at end of 2023 (1.60% in 2022). The Bank’s shares ranked ninth among all listed entities at the CSE as at end of 2023 (twelfth in 2022) and first among the listed corporates in the Banking sector similar to 2022.

2.1 Movement of COMB voting share price over the year
Table – 28| Month | Jan-23 | Feb-23 | Mar-23 | Apr-23 | May-23 | Jun-23 | Jul-23 | Aug-23 | Sep-23 | Oct-23 | Nov-23 | Dec-23 |
| Highest price (Rs.) | 61.00 | 70.00 | 71.90 | 64.00 | 61.60 | 69.90 | 94.20 | 107.50 | 96.00 | 90.00 | 88.90 | 95.60 |
| Lowest price (Rs.) | 50.00 | 56.40 | 62.50 | 56.50 | 52.10 | 56.70 | 75.50 | 80.00 | 86.50 | 80.00 | 82.50 | 87.90 |
| Price at the month end (Rs.) | 56.20 | 65.00 | 63.60 | 56.70 | 56.70 | 68.10 | 92.90 | 86.60 | 90.20 | 82.20 | 87.10 | 95.50 |
2.2 Share price movement of last five years (As per Rule No. 7.6 (xi) of the Listing Rules of the CSE)
Table – 29| Year | 2023 Rs. |
2022 Rs. |
2021 Rs. |
2020 Rs. |
2019 Rs. |
| Ordinary shares – Voting | |||||
| Highest price during the year | 107.50 | 85.00 | 105.00 | 96.00 | 115.90 |
| Lowest price during the year | 50.00 | 48.70 | 76.90 | 50.00 | 88.60 |
| Last traded price | 95.50 | 50.20 | 79.30 | 80.90 | 95.00 |
| Ordinary shares – Non-voting | |||||
| Highest price during the year | 89.00 | 78.50 | 95.90 | 87.20 | 99.40 |
| Lowest price during the year | 40.00 | 39.40 | 69.60 | 48.00 | 74.00 |
| Last traded price | 80.40 | 41.30 | 72.00 | 70.10 | 83.00 |


2.3 Sustainable value for investors
Table – 30| Ordinary shares – Voting |
Ordinary shares – Non-voting |
|||||
| Trade date | 2023 Rs. |
2022 Rs. |
Trade date | 2023 Rs. |
2022 Rs. |
|
| Highest price | August 10, 2023 | 107.50 | August 11, 2023 | 89.00 | ||
| January 24, 2022 | 85.00 | January 24, 2022 | 78.50 | |||
| Lowest price | January 02, 2023 | 50.00 | January 19, 2023 | 40.00 | ||
| November 08, 2022 | 48.70 | August 19, 2022 | 39.40 | |||
| Year-end price | 95.50 | 50.20 | 80.40 | 41.30 | ||
2.4 Information on shareholders’ funds and Bank’s market capitalisation
Table – 31| As at December 31, | Shareholders' funds Rs. Bn. |
Commercial Bank's market capitalisation (*) Rs. Bn. |
Total market capitalisation of the CSE Rs. Bn. |
Commercial Bank's market capitalisation as a % of CSE market capitalisation % |
Commercial Bank's market capitalisation ranking Rank |
Commercial Bank's market capitalisation (*) USD Mn. |
| 2023 | 215 | 124 | 4,249 | 2.93 | 9 | 383.429 |
| 2022 | 204 | 62 | 3,847 | 1.60 | 12 | 167.824 |
| 2021 | 165 | 94 | 5,490 | 1.72 | 9 | 470.963 |
| 2020 | 157 | 94 | 2,961 | 3.16 | 5 | 500.902 |
| 2019 | 133 | 97 | 2,851 | 3.40 | 4 | 532.699 |
(*) Market capitalisation includes both voting and non-voting shares.
2.5 Number of share transactions
Table – 32| 2023 | 2022 | 2021 | 2020 | 2019 | |
| Ordinary shares – Voting | 42,212 | 25,271 | 58,754 | 85,914 | 21,481 |
| Ordinary shares – Non-voting | 13,897 | 10,075 | 18,827 | 21,407 | 5,452 |
2.6 Number of shares traded (‘000)
Table – 33| 2023 | 2022 | 2021 | 2020 | 2019 | |
| Ordinary shares – Voting | 94,863 | 114,432 | 187,853 | 385,017 | 89,289 |
| Ordinary shares – Non-voting | 16,052 | 8,355 | 15,712 | 26,614 | 5,893 |


3. Dividends
We want to emphasise that the Bank recognises and comprehends the importance of declaring dividends as a means to strike a balance between shareholder expectations and the Bank’s business requirements. While the Bank had been distributing interim cash dividends until 2019, there have been no such payments made since then until December 31, 2023. This was in compliance with the requirements of the Banking Act Direction No. 03 of 2020 dated May 13, 2020, the Direction No. 01 of 2021 dated January 19, 2021, the Direction No. 11 of 2021 dated July 13, 2021, the Direction No. 02 of 2022 dated May 06, 2022 and the Direction No. 01 of 2023 dated February 02, 2023, issued by the CBSL on “Restrictions on Discretionary Payments of Licensed Banks”, wherein licensed banks were instructed to refrain from declaring cash dividends for financial years ended December 31, 2020, 2021, 2022 and 2023, respectively, in view of the possible adverse impact on liquidity and other key performance indicators of banks. However, as per the Banking Act Direction No. 01 of 2021, the Direction No. 11 of 2021 and the Direction No. 02 of 2022, Direction No. 01 of 2023 issued by the CBSL on the same subject, licensed banks incorporated or established in Sri Lanka were instructed to defer payment of cash dividends until the financial statements for the year ended December 31, 2020, 2021, 2022 and 2023, respectively, are finalised and audited by the External Auditors.
Accordingly, the Board of Directors of the Bank after giving due consideration to the requirements stipulated in the Banking Act Directions No. 01 of 2023, has now recommended a final dividend of Rs. 6.50 per share for both ordinary voting and non-voting shares of the Bank. This will be paid in the form of a cash dividend of Rs. 4.50 per share and a scrip dividend of Rs. 2.00 per share for both voting and non-voting shareholders of the Bank for the year ended December 31, 2023. This proposed first and final dividend for the year 2023 will be submitted for the approval of the shareholders at the 55th AGM, to be held on March 28, 2024. (A dividend of Rs. 4.50 per share was declared and paid by the Bank for the year ended December 31, 2022, in the form of issue and allotment of new shares for both voting and non-voting).
3.1 Dividend information (As per Rule No. 7.6 (xi) of the Listing Rules of the CSE)
Table – 34| Dividends | 2023 | 2022 | 2021 | 2020 | 2019 |
| Cash – Rs. per share | |||||
| First interim paid | – | – | – | – | 1.50 |
| Second interim paid | – | – | – | – | 3.00 |
| Final proposed/paid | 4.50 | – | 4.50 | 4.50 | – |
| Total | 4.50 | – | 4.50 | 4.50 | 4.50 |
| Scrip – Rs. per share | |||||
| Final proposed/allotted | 2.00 | 4.50 | 3.00 | 2.00 | 2.00 |
| Total | 6.50 | 4.50 | 7.50 | 6.50 | 6.50 |
| Gross dividend proposed/paid (Rs. Bn.) | |||||
| Cash | 5.91 | – | 5.37 | 5.25 | 4.62 |
| Scrip | 2.63 | 5.58 | 3.58 | 2.34 | 2.06 |
| Total | 8.54 | 5.58 | 8.95 | 7.59 | 6.68 |
| Dividend payout ratio (%) | |||||
| Cash | 28.90 | – | 22.77 | 32.07 | 27.16 |
| Cash and shares | 41.75 | 24.29 | 37.94 | 46.33 | 39.23 |


4. Shareholders
The Bank had 15,857 ordinary voting shareholders and 5,702 ordinary non-voting shareholders as at December 31, 2023, compared to 17,022 and 5,989 voting and non-voting shareholders as at December 31, 2022 (Table 35 on page 152). With one new investor joining ranks, the percentage of ordinary voting shares held by the 20 largest shareholders as at end 2023 marginally increased to 77.09% from 76.85% as at end 2022. Similarly, with four new investors joining ranks, an increase was witnessed in the non-voting ordinary shares held by the 20 largest shareholders to 36.48% as at end 2023 from 33.90% as at end 2022.
4.1 Number of ordinary shareholders
Table – 35| As at December 31, | 2023 Nos. |
2022 Nos. |
| Ordinary shareholders – Voting | 15,857 | 17,022 |
| Ordinary shareholders – Non-voting | 5,702 | 5,989 |
| Total | 21,559 | 23,011 |
4.2 The names, number of shares and percentages of shares held by the twenty largest shareholders (As per rule No. 7.6 (iii) of the Listing Rules of the CSE)
Voting shareholders
Table – 36| As at December 31, | 2023 | 2022 (*) | |||
| Ordinary shares – Voting | Number of shares | % | Number of shares | % | |
| 1. | DFCC Bank PLC A/C 1 | 149,777,568 | 12.11 | 141,453,570 | 12.12 |
| 2. | Mr Y S H I Silva | 122,327,008 | 9.89 | 115,528,595 | 9.90 |
| 3. | Employees Provident Fund | 106,485,764 | 8.61 | 100,567,740 | 8.62 |
| 4. | Mr D P Pieris | 95,321,291 | 7.71 | 90,005,231 | 7.71 |
| 5. | CB NY S/A International Finance Corporation | 87,919,750 | 7.11 | 83,033,546 | 7.11 |
| 6. | Sri Lanka Insurance Corporation Ltd. – Life Fund | 62,371,928 | 5.04 | 58,905,563 | 5.05 |
| 7. | Melstacorp PLC | 51,131,771 | 4.14 | 48,290,086 | 4.14 |
| 8. | Mr K D D Perera | 45,418,533 | 3.67 | 42,894,365 | 3.67 |
| 9. | CB NY S/A IFC Emerging Asia Fund. LP | 45,325,490 | 3.67 | 42,806,493 | 3.67 |
| 9. | CB NY S/A IFC Financial Institutions Growth Fund LP | 45,325,490 | 3.67 | 42,806,493 | 3.67 |
| 11. | Sri Lanka Insurance Corporation Ltd. – General Fund | 43,737,539 | 3.54 | 41,306,794 | 3.54 |
| 12. | Employees Trust Fund Board | 20,004,314 | 1.62 | 20,330,734 | 1.74 |
| 13. | Renuka Hotels PLC | 15,939,738 | 1.29 | 15,053,876 | 1.29 |
| 14. | Cargo Boat Development Company PLC | 11,186,898 | 0.90 | 10,565,178 | 0.91 |
| 15. | Mr M J Fernando (Deceased) | 11,109,917 | 0.90 | 10,492,476 | 0.90 |
| 16. | Hallsville Frontier Equities Ltd. | 10,876,310 | 0.88 | 10,271,852 | 0.88 |
| 17. | Renuka Consultants & Services Limited | 9,821,527 | 0.79 | 9,275,689 | 0.79 |
| 18. | Mr A H Munasinghe | 7,123,095 | 0.58 | 7,660,822 | 0.66 |
| 19. | SSBT – Global Macro Capital Opportunities Portfolio | 6,071,633 | 0.49 | – | – |
| 20. | Seylan Bank PLC/Andaradeniya Estate (Pvt) Ltd. | 5,882,457 | 0.48 | 5,555,536 | 0.48 |
| Subtotal | 953,158,021 | 77.09 | 896,804,639 | 76.85 | |
| Other shareholders | 283,367,374 | 22.91 | 270,431,803 | 23.15 | |
| Total | 1,236,525,395 | 100.00 | 1,167,236,442 | 100.00 | |
(*) Comparative shareholdings as at December 31, 2022 of the twenty largest voting shareholders as at December 31, 2023.
Non-voting shareholders
Table – 37| As at December 31, | 2023 | 2022 (*) | |||
| Ordinary shares – Non-voting | Number of shares | % | Number of shares | % | |
| 1. | Employees Trust Fund Board | 6,036,439 | 7.78 | 5,643,261 | 7.78 |
| 2. | Akbar Brothers (Pvt) Ltd. A/C No. 1 | 3,764,303 | 4.85 | 3,542,491 | 4.88 |
| 3. | GF Capital Global Limited | 1,906,146 | 2.46 | 1,875,479 | 2.59 |
| 4. | Mr M F Hashim | 1,398,829 | 1.80 | 1,304,361 | 1.80 |
| 5. | M J F Exports (Pvt) Ltd. | 1,327,409 | 1.71 | 1,240,950 | 1.71 |
| 6. | Mrs L V C Samarasinha | 1,224,239 | 1.58 | 1,144,500 | 1.58 |
| 7. | EMFI Capital Limited | 1,197,019 | 1.54 | 156,024 | 0.22 |
| 8. | Mr T W A Wickramasinghe, Mrs N Wickramasinghe (Joint) | 1,180,375 | 1.52 | 985,150 | 1.36 |
| 9. | Janashakthi Insurance PLC – Shareholders | 1,151,537 | 1.48 | 1,076,533 | 1.48 |
| 10. | Saboor Chatoor (Pvt) Ltd. | 1,110,307 | 1.43 | 1,037,989 | 1.43 |
| 11. | Assetline Finance Limited/Suhada Gas Distributors (Pvt) Ltd. | 922,371 | 1.19 | – | – |
| 12. | Mr E Chatoor | 918,991 | 1.18 | 859,134 | 1.18 |
| 13. | Mr R Gautam | 848,054 | 1.09 | 786,344 | 1.08 |
| 14. | Mr K S M De Silva | 814,467 | 1.05 | 758,418 | 1.05 |
| 15. | Mr A L Gooneratne, Mrs C Gooneratne (Joint) | 799,839 | 1.03 | 747,743 | 1.03 |
| 16. | Mr J D Bandaranayake, Ms N Bandaranayake and Dr V Bandaranayake (Joint) | 784,297 | 1.01 | 772,196 | 1.06 |
| 17. | Mr J D Bandaranayake, Dr V Bandaranayake and Ms I Bandaranayake (Joint) | 764,347 | 0.99 | 749,713 | 1.03 |
| 18. | Mr M J Fernando (Deceased) | 762,425 | 0.98 | 712,766 | 0.98 |
| 19. | Serendip Investments Limited | 707,500 | 0.91 | 661,418 | 0.91 |
| 20. | Swastika Mills Ltd. | 694,940 | 0.90 | 542,173 | 0.75 |
| Subtotal | 28,313,834 | 36.48 | 24,596,643 | 33.90 | |
| Other shareholders | 49,281,899 | 63.52 | 47,944,962 | 66.10 | |
| Total | 77,595,733 | 100.00 | 72,541,605 | 100.00 | |
(*) Comparative shareholdings as at December 31, 2022 of the twenty largest non-voting shareholders as at December 31, 2023.
4.3 Public shareholding [As per rule No. 7.6 (iv) and 7.13.1 of the Listing Rules of the CSE]
Table – 38| As at December 31, | 2023 | 2022 | ||
| % | % | |||
| Number of shareholders representing the public holding (Voting) | 15,820 | 99.81 | 16,989 | 99.81 |
| Number of shareholders representing the public holding (Non-voting) | 5,698 | 99.88 | 5,985 | 99.88 |
| Float adjusted market capitalisation Rs. Bn. (Compliant under Option 1) | 124 | 61 | ||
4.4 Directors’ shareholding including the Chief Executive Officer’s shareholding (As per Rule No. 7.6 (v) of the Listing Rules of the CSE)
Table – 39| Ordinary shares voting | Ordinary shares non-voting | |||
| As at December 31, | 2023 | 2022 | 2023 | 2022 |
| Prof A K W Jayawardane – Chairman | 14,379 | 13,580 | Nil | Nil |
| Mr Sharhan Muhseen – Deputy Chairman | 2,750 | 2,598 | Nil | Nil |
| Mr S C U Manatunge – Managing Director/Chief Executive Officer | 118,599 | 75,815 | Nil | Nil |
| Mr S Prabagar – Chief Operating Officer | 251,136 | 165,703 | 26,290 | 24,578 |
| Mr K Dharmasiri (*) | Nil | Nil | Nil | Nil |
| Mr L D Niyangoda | Nil | Nil | Nil | Nil |
| Ms N T M S Cooray | 384,987 | 363,592 | 60,360 | 56,429 |
| Ms J Lee | Nil | Nil | Nil | Nil |
| Mr R Senanayake | Nil | Nil | Nil | Nil |
| Ms D L T S Wijewardena | Nil | Nil | Nil | Nil |
| Dr Sivakumar Selliah | 28,759 | 27,161 | Nil | Nil |
| Mr D N L Fernando (**) | Nil | Nil | Nil | Nil |
| Mr P M Kumarasinghe (***) | Nil | Nil | Nil | Nil |
(*) Retired w.e.f. January 8, 2023
(**) Appointed as a Director w.e.f. February 7, 2023
(***) Appointed as a Director w.e.f. April 12, 2023
4.5 Distribution schedule of number of holders and percentage of holding in each class of equity securities (As per rule No. 7.6 (x) of the Listing Rules of the CSE)
Table – 40| As at December 31, 2023 | As at December 31, 2022 | ||||||||
| Number of shareholders |
Percentage % |
Number of shares |
Percentage % |
Number of shareholders |
Percentage % |
Number of shares |
Percentage % |
||
| Ordinary shares – Voting | |||||||||
| 1 | – 1,000 | 9,060 | 57.14 | 1,994,558 | 0.16 | 9,449 | 55.51 | 2,195,132 | 0.19 |
| 1,001 | – 10,000 | 4,467 | 28.17 | 15,856,461 | 1.28 | 5,164 | 30.34 | 17,649,929 | 1.51 |
| 10,001 | – 100,000 | 1,916 | 12.08 | 56,004,738 | 4.53 | 2,024 | 11.89 | 56,831,179 | 4.87 |
| 100,001 | – 1,000,000 | 348 | 2.19 | 96,225,753 | 7.78 | 322 | 1.89 | 83,764,568 | 7.18 |
| Over | 1,000,000 | 66 | 0.42 | 1,066,443,885 | 86.25 | 63 | 0.37 | 1,006,795,634 | 86.25 |
| Total | 15,857 | 100.00 | 1,236,525,395 | 100.00 | 17,022 | 100.00 | 1,167,236,442 | 100.00 | |
| Ordinary shares – Non-voting | |||||||||
| 1 | – 1,000 | 3,215 | 56.38 | 742,221 | 0.96 | 3,272 | 54.63 | 774,139 | 1.07 |
| 1,001 | – 10,000 | 1,722 | 30.20 | 6,055,133 | 7.80 | 1,936 | 32.33 | 6,551,991 | 9.03 |
| 10,001 | – 100,000 | 642 | 11.26 | 18,189,009 | 23.44 | 669 | 11.17 | 18,351,415 | 25.30 |
| 100,001 | – 1,000,000 | 113 | 1.98 | 32,312,767 | 41.64 | 103 | 1.72 | 28,236,318 | 38.92 |
| Over | 1,000,000 | 10 | 0.18 | 20,296,603 | 26.16 | 9 | 0.15 | 18,627,742 | 25.68 |
| Total | 5,702 | 100.00 | 77,595,733 | 100.00 | 5,989 | 100.00 | 72,541,605 | 100.00 | |
4.6 Composition of shareholders based on residency and category
Table – 41| As at December 31, 2023 | As at December 31, 2022 | |||||||
| Number of shareholders |
Percentage % |
Number of shares |
Percentage % |
Number of shareholders |
Percentage % |
Number of shares |
Percentage % |
|
| Ordinary shares – Voting | ||||||||
| Resident | 15,607 | 98.42 | 1,013,925,355 | 82.00 | 16,774 | 98.54 | 965,754,985 | 82.74 |
| Non-resident | 250 | 1.58 | 222,600,040 | 18.00 | 248 | 1.46 | 201,481,457 | 17.26 |
| Total | 15,857 | 100.00 | 1,236,525,395 | 100.00 | 17,022 | 100.00 | 1,167,236,442 | 100.00 |
| Individuals | 15,197 | 95.84 | 441,206,246 | 35.68 | 16,369 | 96.16 | 427,935,318 | 36.66 |
| Institutions | 660 | 4.16 | 795,319,149 | 64.32 | 653 | 3.84 | 739,301,124 | 63.34 |
| Total | 15,857 | 100.00 | 1,236,525,395 | 100.00 | 17,022 | 100.00 | 1,167,236,442 | 100.00 |
| Ordinary shares – Non-voting | ||||||||
| Resident | 5,629 | 98.72 | 71,721,622 | 92.43 | 5,915 | 98.76 | 68,026,397 | 93.78 |
| Non-resident | 73 | 1.28 | 5,874,111 | 7.57 | 74 | 1.24 | 4,515,208 | 6.22 |
| Total | 5,702 | 100.00 | 77,595,733 | 100.00 | 5,989 | 100.00 | 72,541,605 | 100.00 |
| Individuals | 5,464 | 95.83 | 48,889,575 | 63.01 | 5,752 | 96.04 | 47,993,209 | 66.16 |
| Institutions | 238 | 4.17 | 28,706,158 | 36.99 | 237 | 3.96 | 24,548,396 | 33.84 |
| Total | 5,702 | 100.00 | 77,595,733 | 100.00 | 5,989 | 100.00 | 72,541,605 | 100.00 |
5. Material foreseeable risk factors (As per Rule No. 7.6 (vi) of the Listing Rules of the CSE)
Information pertaining to the material foreseeable risk factors, that require disclosures as per the Rule No. 7.6 (vi) of the Listing Rules of the CSE is discussed in the Section on “Risk Governance and Management” on pages 232 to 258.
6. Material issues pertaining to employees and industrial relations pertaining to the Bank (As per Rule No. 7.6 (vii) of the Listing Rules of the CSE)
During the year under review, there were no material issues relating to employees and industrial relations pertaining to the Bank, which warrant disclosure.
7. Information on movement in number of shares represented by the stated capital (As per rule No. 7.6 (ix) of the Listing Rules of the CSE)
Table – 42| Year | Description | Type of share | Basis | Number of shares issued/(redeemed) | Number of shares | ||
| Ordinary shares – voting |
Ordinary shares non-voting |
Cumulative redeemable preference shares |
|||||
| 1987 | As at December 31, 1987 | – | 3,000,000 | – | – | ||
| 1988 | Bonus Issue | Voting | 2 for 3 | 2,000,000 | 5,000,000 | – | – |
| 1990 | Bonus Issue | Voting | 1 for 1 | 5,000,000 | 10,000,000 | – | – |
| 1993 | Rights Issue | Voting | 1 for 4 | 2,500,000 | 12,500,000 | – | – |
| 1996 | Bonus Issue | Voting | 3 for 5 | 7,500,000 | 20,000,000 | – | – |
| Rights Issue | Voting | 1 for 4 | 5,000,000 | 25,000,000 | – | – | |
| Share Swap | Non-voting | 894,275 | 25,000,000 | 894,275 | – | ||
| Bonus Issue | Non-voting | 3 for 5 | 536,565 | 25,000,000 | 1,430,840 | – | |
| Rights Issue | Non-voting | 1 for 4 | 357,710 | 25,000,000 | 1,788,550 | – | |
| 1998 | Bonus Issue | Voting | 3 for 10 | 7,500,000 | 32,500,000 | 1,788,550 | – |
| Bonus Issue | Non-voting | 3 for 10 | 536,565 | 32,500,000 | 2,325,115 | – | |
| 2001 | Bonus Issue | Voting | 1 for 5 | 6,500,000 | 39,000,000 | 2,325,115 | – |
| Bonus Issue | Non-voting | 1 for 5 | 465,023 | 39,000,000 | 2,790,138 | – | |
| Issue of cumulative redeemable preference shares |
90,655,500 | 39,000,000 | 2,790,138 | 90,655,500 | |||
| 2003 | Bonus Issue | Voting | 1 for 3 | 13,000,000 | 52,000,000 | 2,790,138 | 90,655,500 |
| Rights Issue | Voting | 1 for 4 | 13,000,000 | 65,000,000 | 2,790,138 | 90,655,500 | |
| Bonus Issue | Non-voting | 1 for 3 | 930,046 | 65,000,000 | 3,720,184 | 90,655,500 | |
| Rights Issue | Non-voting | 1 for 4 | 930,046 | 65,000,000 | 4,650,230 | 90,655,500 | |
| Issue of cumulative redeemable preference shares |
100,000,000 | 65,000,000 | 4,650,230 | 190,655,500 | |||
| 2004 | ESOP | Voting | 29,769 | 65,029,769 | 4,650,230 | 190,655,500 | |
| 2005 | ESOP | Voting | 1,361,591 | 66,391,360 | 4,650,230 | 190,655,500 | |
| Bonus Issue | Voting | 1 for 1 | 66,389,162 | 132,780,522 | 4,650,230 | 190,655,500 | |
| Bonus Issue | Non-voting | 1 for 1 | 4,650,230 | 132,780,522 | 9,300,460 | 190,655,500 | |
| 2006 | ESOP | Voting | 737,742 | 133,518,264 | 9,300,460 | 190,655,500 | |
| Redemption of cumulative redeemable preference shares |
(90,655,500) | 133,518,264 | 9,300,460 | 100,000,000 | |||
| 2007 | Rights Issue | Voting | 3 for 10 | 40,288,996 | 173,807,260 | 9,300,460 | 100,000,000 |
| Bonus Issue | Voting | 1 for 3 | 58,204,268 | 232,011,528 | 9,300,460 | 100,000,000 | |
| ESOP | Voting | 919,649 | 232,931,177 | 9,300,460 | 100,000,000 | ||
| Rights Issue | Non-voting | 3 for 10 | 2,790,138 | 232,931,177 | 12,090,598 | 100,000,000 | |
| Bonus Issue | Non-voting | 1 for 3 | 4,030,199 | 232,931,177 | 16,120,797 | 100,000,000 | |
| 2008 | Redemption of cumulative redeemable preference shares |
(100,000,000) | 232,931,177 | 16,120,797 | – | ||
| ESOP | Voting | 350,049 | 233,281,226 | 16,120,797 | – | ||
| 2009 | ESOP | Voting | 540,045 | 233,821,271 | 16,120,797 | – | |
| 2010 | Share Split | Voting | 1 for 2 | 117,402,608 | 351,223,879 | 16,120,797 | – |
| Share Split | Non-voting | 1 for 2 | 8,060,398 | 351,223,879 | 24,181,195 | – | |
| ESOP | Voting | 2,081,508 | 353,305,387 | 24,181,195 | – | ||
| 2011 | Scrip issue for final dividend 2010 | Voting | Rs. 2.00 per share |
2,277,195 | 355,582,582 | 24,181,195 | – |
| Scrip issue for final dividend 2010 | Non-voting | 255,734 | 355,582,582 | 24,436,929 | – | ||
| ESOP | Voting | 1,457,645 | 357,040,227 | 24,436,929 | – | ||
| Rights Issue | Voting | 1 for 14 | 25,502,433 | 382,542,660 | 24,436,929 | – | |
| Rights Issue | Non-voting | 1 for 14 | 1,745,494 | 382,542,660 | 26,182,423 | – | |
| Share Split | Voting | 1 for 1 | 382,542,660 | 765,085,320 | 26,182,423 | – | |
| Share Split | Non-voting | 1 for 1 | 26,182,423 | 765,085,320 | 52,364,846 | – | |
| 2012 | Scrip issue for final dividend 2011 | Voting | Rs. 2.00 per share |
13,587,144 | 778,672,464 | 52,364,846 | – |
| Scrip issue for final dividend 2011 | Non-voting | 1,108,902 | 778,672,464 | 53,473,748 | – | ||
| ESOP | Voting | 1,341,768 | 780,014,232 | 53,473,748 | – | ||
| 2013 | Scrip issue for final dividend 2012 | Voting | Rs. 2.00 per share |
13,076,189 | 793,090,421 | 53,473,748 | – |
| Scrip issue for final dividend 2012 | Non-voting | 1,069,474 | 793,090,421 | 54,543,222 | – | ||
| ESOP | Voting | 1,445,398 | 794,535,819 | 54,543,222 | – | ||
| 2014 | Scrip issue for final dividend 2013 | Voting | Rs. 2.00 per share |
12,504,344 | 807,040,163 | 54,543,222 | – |
| Scrip issue for final dividend 2013 | Non-voting | 1,036,724 | 807,040,163 | 55,579,946 | – | ||
| ESOP | Voting | 3,237,566 | 810,277,729 | 55,579,946 | – | ||
| 2015 | Scrip issue for final dividend 2014 | Voting | Rs. 2.00 per share |
8,118,773 | 818,396,502 | 55,579,946 | – |
| Scrip issue for final dividend 2014 | Non-voting | 719,740 | 818,396,502 | 56,299,686 | – | ||
| ESOP | Voting | 2,170,613 | 820,567,115 | 56,299,686 | – | ||
| 2016 | Scrip issue for final dividend 2015 | Voting | Rs. 2.00 per share |
11,818,040 | 832,385,155 | 56,299,686 | – |
| Scrip issue for final dividend 2015 | Non-voting | 912,967 | 832,385,155 | 57,212,653 | – | ||
| ESOP | Voting | 1,136,732 | 833,521,887 | 57,212,653 | – | ||
| 2017 | Scrip issue for final dividend 2016 | Voting | Rs. 2.00 per share |
10,521,802 | 844,043,689 | 57,212,653 | – |
| Scrip issue for final dividend 2016 | Non-voting | 903,357 | 844,043,689 | 58,116,010 | – | ||
| Rights Issue | Voting | 1 for 10 | 84,649,465 | 928,693,154 | 58,116,010 | – | |
| Rights Issue | Non-voting | 1 for 10 | 5,811,601 | 928,693,154 | 63,927,611 | – | |
| ESOP | Voting | 3,278,537 | 931,971,691 | 63,927,611 | – | ||
| 2018 | Scrip issue for final dividend 2017 | Voting | Rs. 2.00 per share |
11,998,388 | 943,970,079 | 63,927,611 | – |
| Scrip issue for final dividend 2017 | Non-voting | 1,085,563 | 943,970,079 | 65,013,174 | – | ||
| ESOP | Voting | 1,739,324 | 945,709,403 | 65,013,174 | – | ||
| 2019 | Scrip issue for final dividend 2018 | Voting | Rs. 2.00 per share |
15,249,529 | 960,958,932 | 65,013,174 | – |
| Scrip issue for final dividend 2018 | Non-voting | 1,241,095 | 960,958,932 | 66,254,269 | – | ||
| ESOP | Voting | 293,385.00 | 961,252,317 | 66,254,269 | – | ||
| 2020 | Scrip issue for final dividend 2019 | Voting | Rs. 2.00 per share |
22,485,434 | 983,737,751 | 66,254,269 | – |
| Scrip issue for final dividend 2019 | Non-voting | 1,716,432 | 983,737,751 | 67,970,701 | – | ||
| Issue of shares via a private placement | Voting | 115,197,186 | 1,098,934,937 | 67,970,701 | – | ||
| 2021 | Scrip issue for final dividend 2020 | Voting | Rs. 2.00 per share |
25,071,337 | 1,124,006,274 | 67,970,701 | – |
| Scrip issue for final dividend 2020 | Non-voting | 1,770,070 | 1,124,006,274 | 69,740,771 | – | ||
| ESOP | Voting | 474,254 | 1,124,480,528 | 69,740,771 | – | ||
| 2022 | Scrip issue for final dividend 2021 | Voting | Rs. 3.00 per share |
42,755,914 | 1,167,236,442 | 69,740,771 | – |
| Scrip issue for final dividend 2021 | Non-voting | 2,800,834 | 1,167,236,442 | 72,541,605 | – | ||
| 2023 | Scrip issue for final dividend 2022 | Voting | Rs. 4.50 per share |
68,687,375 | 1,235,923,817 | 72,541,605 | – |
| Scrip issue for final dividend 2022 | Non-voting | 5,054,128 | 1,235,923,817 | 77,595,733 | – | ||
| ESOP | Voting | 601,578 | 1,236,525,395 | 77,595,733 | – | ||
8. Engaging with shareholders
The Bank has in place a comprehensive Shareholder Communication Policy, which outlines the various formal channels through which it engages with shareholders. It covers the timely communication of quarterly performance of the Group and the Bank as set out on pages 132 to 137 in “Summary of Interim Financial Statements – Group and Bank”. It also records significant events that may reasonably be expected to impact the share price. (More details are given in Financial Calendar on page 261).
Shareholders are kindly requested to provide their valuable feedback on the content of this Annual Report using the “Stakeholder Feedback Form” given at the end of this Annual Report for continuous improvements in the presentation and disclosures made in the Annual Report.
9. Quarterly performance in 2023 compared to 2022 (As per Rule No. 7.5 (a) (i) of the Listing Rules of the CSE)
We wish to inform the shareholders that the Bank duly submitted the Interim Financial Statements for the year 2023 to the CSE within applicable statutory deadlines (The Bank duly complied with this requirement for 2022 as well). Please refer “Financial Calendar” on page 261 for details of the requirements and how the Bank complied with same. Further, a summary of the Income Statement and the Statement of Financial Position depicting quarterly performance during 2023 together with comparatives for 2022 is given in Summary of Interim Financial Statements – Group and Bank on pages 132 to 137 for the information of stakeholders.
The Annual Report comprising of Audited Financial Statements for the year ended December 31, 2023 and the Audited Statement of Financial Position as at December 31, 2023 will be submitted to the CSE within three months from the year end, which is well within the required deadline as required by Rule No. 7.5 (a) of the Listing Rules of the CSE. (The Bank duly complied with this requirement for 2022).
This Annual Report in its entirety is available on the Bank’s website both as a PDF file and as well as an interactive version (http://www.combank.lk/investors).
Shareholders may also elect to receive a hard copy of the Annual Report on request. The Company Secretary of the Bank will respond to individual letters received from shareholders based on the requests made through the specimen request letter included in the booklet sent to shareholders.
10. Debt securities
Details of debentures issued and redeemed by the Bank during the year as well as the balances outstanding and other relevant information is as shown in the Note 50 to the Financial Statements on Subordinated Liabilities on page 368.
10.1 Debenture composition (As per Rule No. 7.6 (xi) of the Listing Rules of the CSE)
Please refer to Note 50 to the Financial Statements on Subordinated Liabilities on page 368 for full details.
Please refer “Financial Highlights” and “Core Financial Soundness Indicators” on pages 16 to 125 for a comprehensive list of financial indicators.
11. Key shareholder return indicators (As per Rule No. 7.6 (xi) of the Listing Rules of the CSE)
Table – 43| Year | 2023 |
2022 |
| Key financial indicators | ||
| Interest margin (%) | 3.32 | 3.74 |
| Return on assets (before tax) (%) | 1.27 | 1.03 |
| Return on equity (%) | 9.78 | 12.46 |
| Net asset value per share (Rs.) | 163.55 | 164.30 |
| Regulatory liquidity | ||
| Liquid assets ratio (%) (Minimum requirement 20%) | ||
| Consolidated (Sri Lankan operations) | 46.06 | 35.88 |
| Liquidity coverage ratio – LCR (%) (Current minimum requirement 100%) | ||
| Rupee | 491.61 | 405.91 |
| All currencies | 516.27 | 293.91 |
| Net stable funding ratio – NSFR (%) (Current minimum requirement 100%) | 193.70 | 173.58 |
| Debt service related ratios | ||
| Debt equity ratio (%) | 16.97 | 34.02 |
| Interest cover (Times) | 8.84 | 7.31 |
| Debt service coverage ratio (%) | 127.11 | 56.84 |
12. Credit ratings (As per Rule No. 7.6 (xi) of the Listing Rules of the CSE)
12.1 National Long-term ratings
Fitch Ratings upgraded the rating Outlook of the Bank’s credit rating to Stable from Negative in October 2023, largely due to ease in downside risks for the banking sector with upgrades to Sri Lanka’s Long-Term-Local-Currency Issuer Default Rating to CCC- from RD (Restricted Default). Earlier in January 2023, Fitch Ratings downgraded the rating assigned to the Bank from AA-(lka) with a Negative Outlook to A (lka) amidst the sovereign downgrade and recalibration of the agency’s Sri Lanka’s national rating scale, along with nine other banks.
Meanwhile, the Bank’s Bangladesh Operation’s credit rating was reaffirmed at AAA by Credit Rating Information Services Ltd in June 2023 for the 13th consecutive year.
The ratings reflect the Bank’s intrinsic financial strength, the established domestic franchise as Sri Lanka’s third-largest bank and the entrenched domestic deposit franchise that underpins the Bank’s funding and liquidity profile.
12.2 Credit ratings – Debentures (As per Rule No. 7.6 (xi) of the Listing Rules of the CSE)
The credit rating of the Bank’s Subordinated Debentures was affirmed as BBB+(lka) by Fitch Ratings Lanka Ltd., in November 2023.