Keyword search
My Report
This financial review offers insights into the Bank’s performance during the year under review. It should be read in conjunction with the Operating Context and Outlook section (pages 48 to 53), which outlines global, local and sector trends influencing the Bank’s performance and the Management Discussion and Analysis section (pages 62 to 159), which elaborates how the Bank enhanced its financial and other capitals within the context of its Sustainability Framework and strategic imperatives.
Performance of the Group
An overview
In a period marked by lingering effects of the challenges from previous years, the Commercial Bank Group, comprising Sri Lanka’s largest private sector bank, its subsidiaries and the associate, concluded the year 2023 with robust operational performance. The Group’s assets grew to Rs. 2.656 Tn., marking a 6.24% (2022: 26.02%) increase from Rs. 2.500 Tn. at the end of 2022. Notably, the Group’s gross income experienced a significant growth, rising by 21.82% (2022: 71.31%) to reach Rs. 341.566 Bn. compared to Rs. 280.387 Bn. in 2022. Moreover, the total operating income and profit after tax for the year amounted to Rs. 122.070 Bn. (2022: Rs. 136.637 Bn.) and Rs. 21.900 Bn. (2022: Rs. 24.399 Bn.), respectively, demonstrating the Group’s resilience and adaptability in navigating challenging economic conditions.
With the Bank representing 97.17% of the total assets (2022: 97.05%) and 93.43% of the Group’s profit after tax (2022: 94.14%), the following analysis delves into the Bank’s financial performance in detail. Subsequently, a brief overview of the Bank’s operations in Bangladesh, other overseas operations, local subsidiaries and the associate is given on pages 128 to 131.
Performance of the Bank
An overview
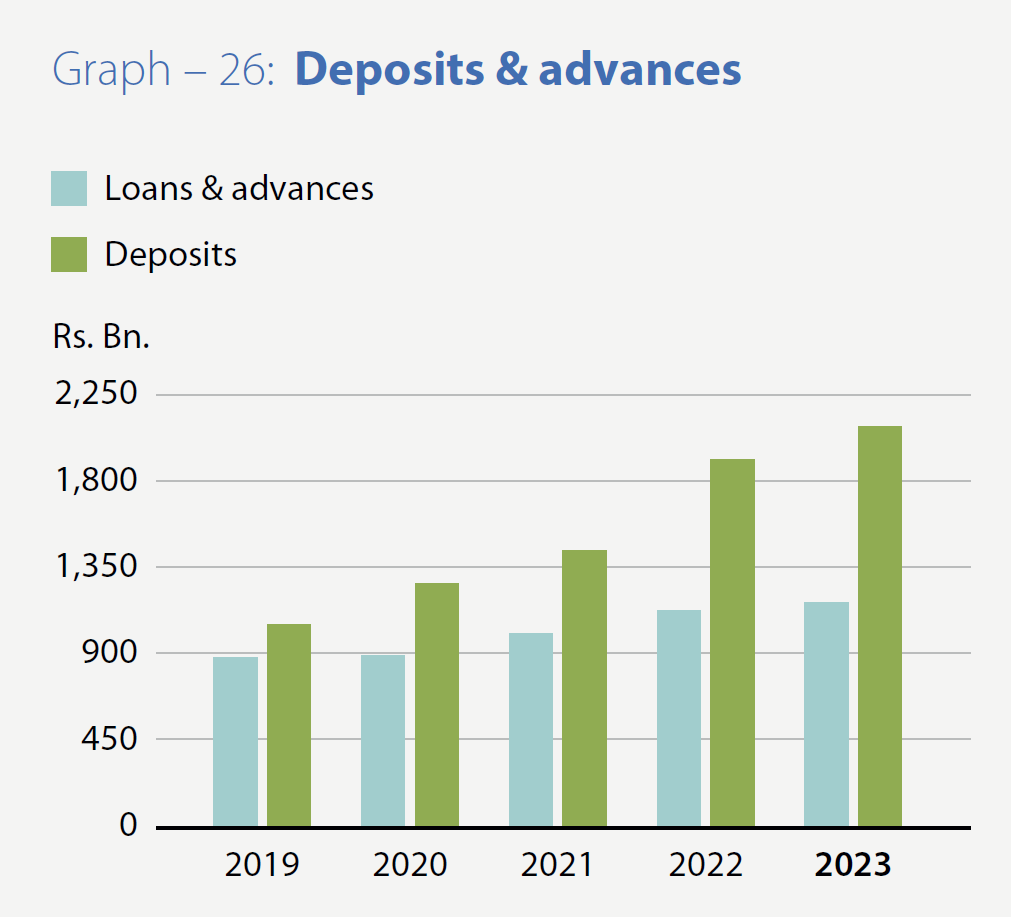
The Bank’s total assets exceeded the Rs. 2.500 Tn. milestone, marking a significant achievement as the first private sector commercial bank to do so, reaching Rs. 2.580 Tn. by December 31, 2023, compared to Rs. 2.426 Tn. in 2022, reflecting a growth of 6.37% (2022: 24.45%). This growth, amounting to Rs. 154.530 Bn., was primarily supported by an increase in deposits, which grew by Rs. 170.687 Bn., or 8.92% (2022: 32.66%), surpassing the Rs. 2.000 Tn. mark for the first time and reaching Rs. 2.085 Tn. by year-end, compared to Rs. 1.914 Tn. in 2022. Notably, Commercial Bank achieved the milestone of being the first private sector bank to surpass Rs. 2.000 Tn. in deposits in the fourth quarter of 2023, maintaining this status to date. The lending portfolio, adjusted for provision for impairment, grew by Rs. 45.917 Bn., or 4.06% (2022: 11.42%), reaching Rs. 1.176 Tn. by the end of the year, compared to Rs. 1.130 Tn. in 2022. It is noteworthy to mention that the Bank was able to increase its market share in total assets, deposits and loans and advances to 13.01%, 12.98% and 11.76% in 2023, respectively from 12.49%, 12.51% and 10.78% respectively, at the end of 2022, as shown in Table 06 on page 52. on the Bank's performance in 2023 compared to the Banking Sector.
It is pertinent to mention that the Bank achieved the above milestones despite the appreciation of the Rupee to 324.25 from 367.00 against the USD by 13.18% during the year.
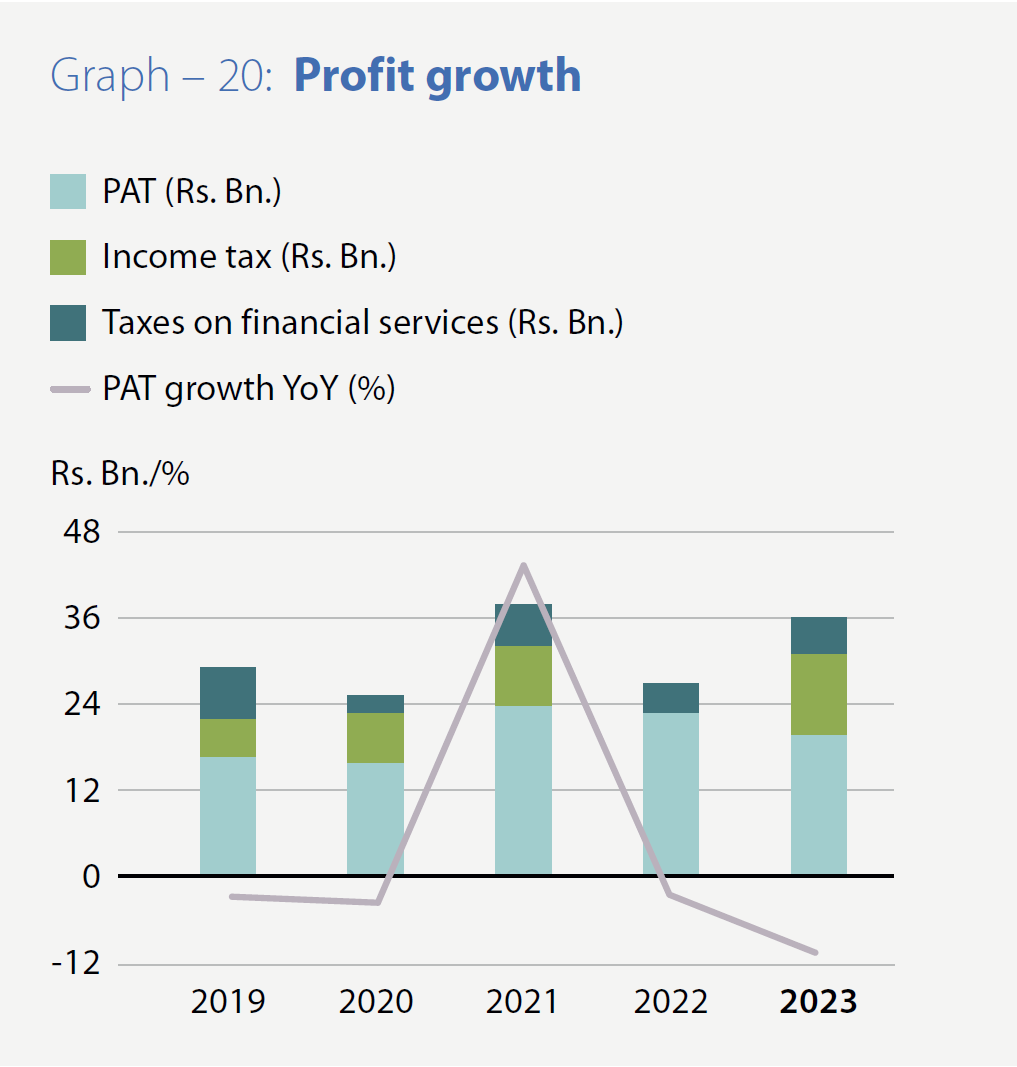
In 2023, the Bank’s profit after tax amounted to Rs. 20.461 Bn., showing a decrease of 10.92% compared to Rs. 22.970 Bn. in 2022, which had experienced a negative growth of 2.70%. This decline is noteworthy considering the high tax regime throughout 2023, contrasting with 2022, where high taxes only affected the second half of the year.
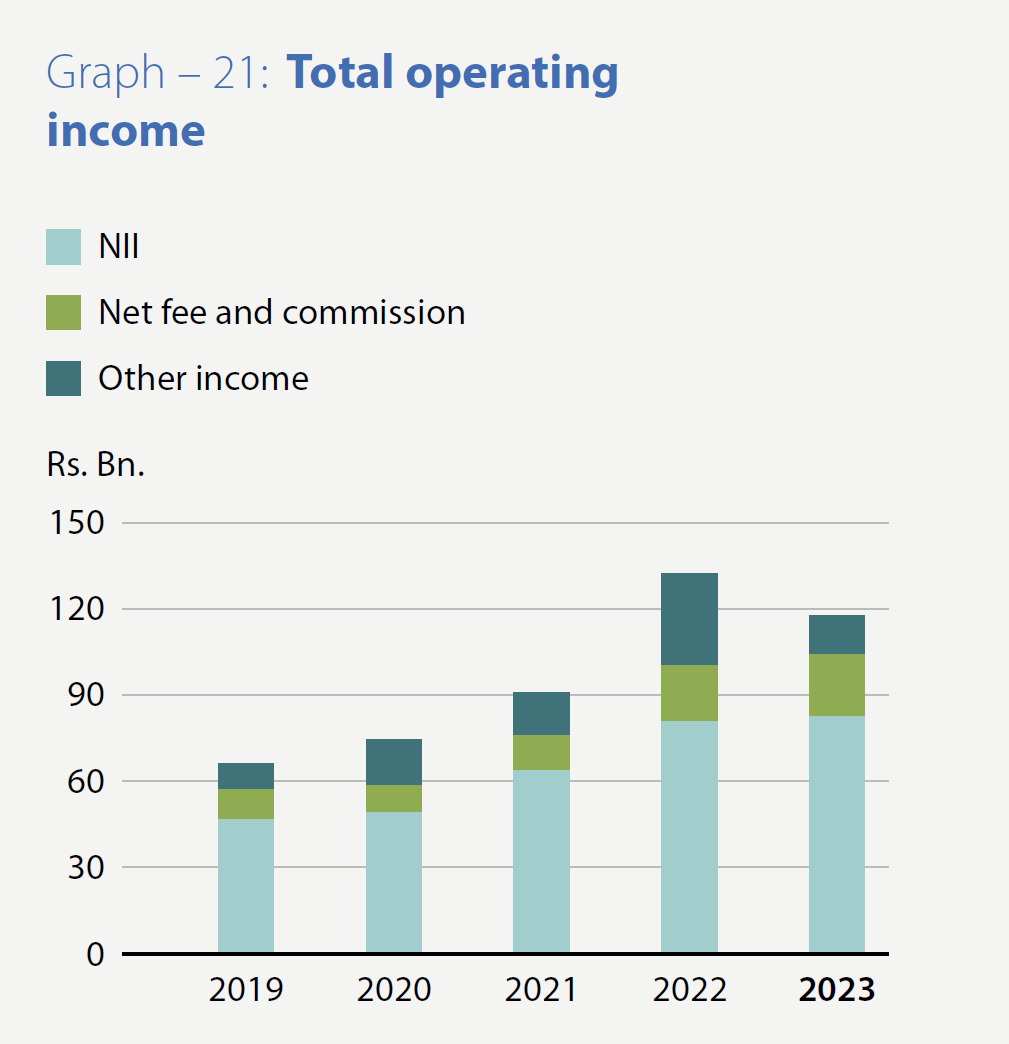
The total operating income for 2023 decreased to Rs. 118.109 Bn., down by 11.12% from Rs. 132.888 Bn. reported in 2022, which had seen a significant increase of 45.40%.
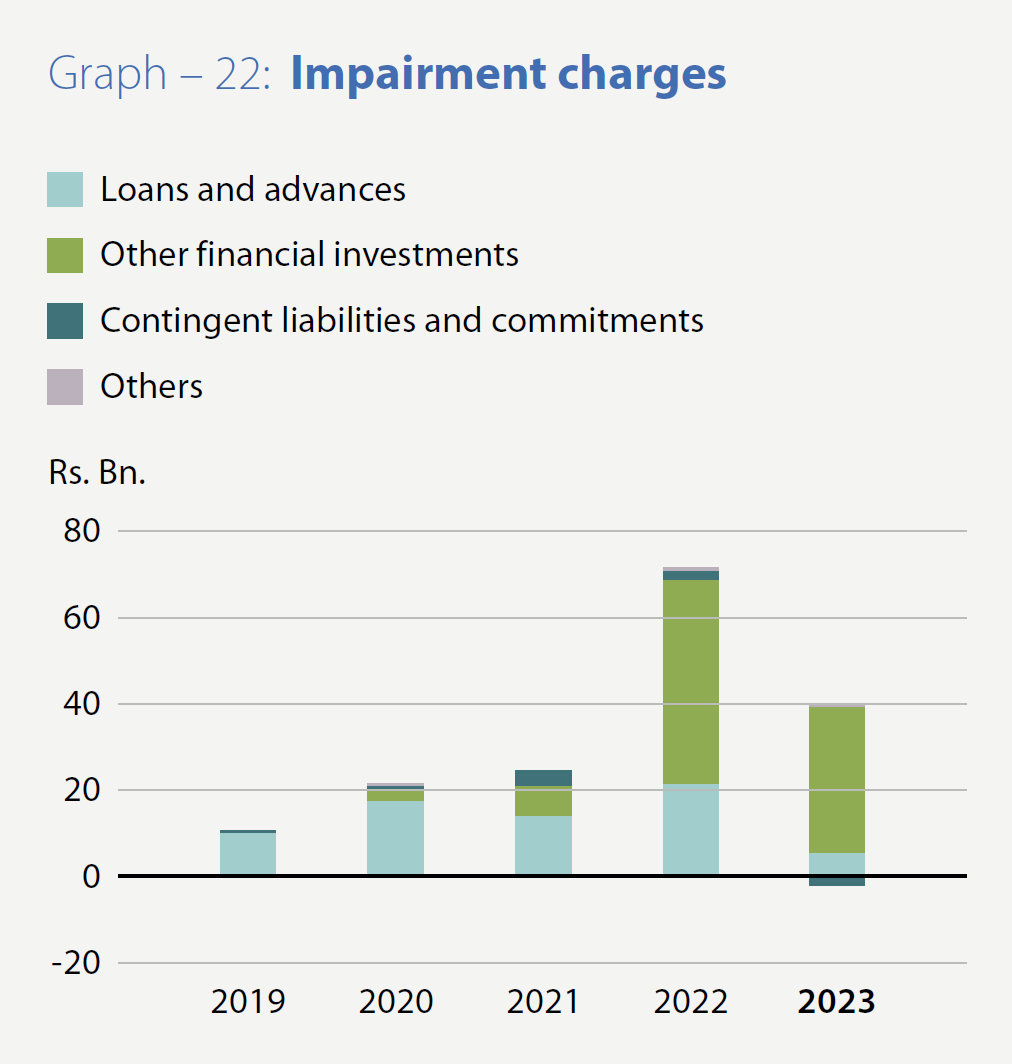
However, impairment charges and other losses for 2023 decreased to Rs. 38.624 Bn., marking a 45.95% reduction compared to Rs. 71.462 Bn. recorded in 2022, which had shown a substantial increase of 189.41%, as detailed on page 306 under "Impairment charges and other losses". This decrease contributed to the Bank’s improvement in net operating income to Rs. 79.486 Bn., up by 29.40% in 2023 from Rs. 61.427 Bn. recorded in 2022, which had decreased by 7.91%.
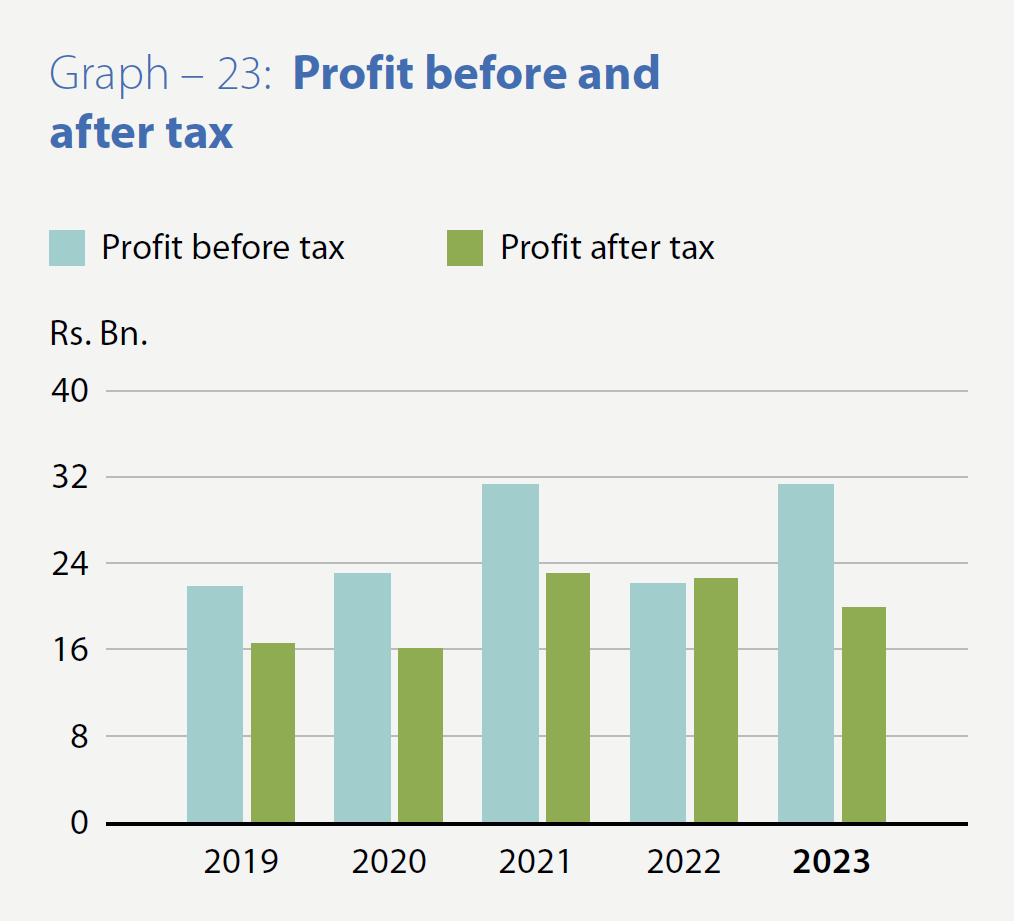
The total operating expenses of the Bank increased to Rs. 42.644 Bn., showing an increase of 22.06% (compared to 20.92% in 2022) from Rs. 34.936 Bn. reported in 2022. Consequently, the profit before tax of the Bank improved to Rs. 31.880 Bn. in 2023 from Rs. 22.598 Bn. in 2022, marking a growth of 41.07% (as against the negative growth of 29.38% in 2022).
The Colombo Stock Exchange witnessed a notable turnaround from its subdued performance in 2022, with both the ASPI and S&P SL20 indices experiencing significant gains by the end of 2023. The ASPI surpassed the 10,000-point mark, rising from 8,500 points, marking a substantial growth of 25.50%. Similarly, the S&P SL20 index exceeded the 3,000-point threshold, showing a notable growth of 16.42%. Against this backdrop, the banking sector observed a remarkable surge in both trading volumes and share prices, attributed to the dissipation of perceived elevated risks associated with the sector stemming from the unprecedented operating conditions of 2022. The banking sector index more than doubled, reaching nearly 800 points by the end of the period. The Bank’s shares maintained the highest price-to-book value and market capitalisation among its peers in the banking sector. Consequently, the Bank’s market capitalisation ranking improved, moving from twelfth place among all listed companies on the Colombo Stock Exchange as of December 31, 2022, to ninth place by December 31, 2023.
Taking into account the Bank’s performance during the year, along with its dividend policy, capital augmentation plan and commitment to providing a reasonable return to shareholders, the Board of Directors has proposed a first and final dividend of Rs. 6.50 per share for the year 2023. This dividend consists of a cash dividend of Rs. 4.50 per share and a scrip dividend of Rs. 2.00 per share. In 2022, the Bank paid only a scrip dividend of Rs. 4.50 per share.
Income statement
Financial intermediation
The gross income increased by 21.90% in 2023, compared to the substantial growth of 71.20% in 2022, reaching Rs. 335.770 Bn., from Rs. 275.444 Bn., reported in 2022. This growth was mainly driven by significant contributions from both fund-based and fee-based operations, although other revenue sources experienced a decline, as elaborated below under “Other Income”. Given that the growth in gross income outpaced the growth in average assets for the year, which stood at 14.43% in 2023 (compared to 18.71% in 2022), the financial intermediation margin (calculated as gross income divided by average total assets) improved to 13.41% by the end of 2023, compared to 12.59% in 2022, representing an improvement of 82 basis points (bps). The financial intermediation margin for the banking sector as a whole stood at 14.56% in 2023.
Fund-based operations
Interest income, constituting 87.15% of the gross income amounting to Rs. 335.770 Bn. (compared to 79.26% in 2022), rose to Rs. 292.618 Bn. in the year from Rs. 218.327 Bn. in 2022, recording an improvement of 34.03% (compared to 67.37% in 2022). This increase was primarily driven by growth in both the average interest-earning assets by Rs. 262.721 Bn. and the average interest rate on interest-earning assets by 2.03%.
The growth in average interest-earning assets was primarily fueled by excess liquidity resulting from the increase in deposits outpacing the growth in loans and advances, leading to investments in Government securities. Notably, the negative growth observed in loans and advances for most part of the year reversed in the fourth quarter, registering a year-on-year growth of 3.76% in gross loans and advances. The average interest rate on interest-earning assets improved due to the re-pricing effect of maturing low-yielding treasury investments and loans and advances being reinvested/ granted at relatively higher rates. Interest income earned from sources other than loans and advances contributed 46.44% of total interest income, compared to 34.46% in 2022, marking an increase of 80.62% compared to 46.47% in 2022. Meanwhile, interest income from loans and advances increased by 9.53% in 2023 (compared to 80.95% growth in 2022), accounting for 53.56% of the total interest income, compared to 65.54% in 2022.
Interest expenses, comprising 71.60% of the interest income (compared to 62.56% in 2022), rose to Rs. 209.515 Bn. during the year from Rs. 136.583 Bn. in 2022, marking a significant increase of 53.40% (compared to a growth of 107.47% in 2022). This increase was primarily driven by growth in average interest-bearing liabilities by Rs. 230.566 Bn. and the rise in the average cost of funds by 2.76%, attributed to the impact of high-cost funding mobilised in 2022. However, the gradual improvement of the CASA ratio of the Bank, considered an industry benchmark, from 38.36% at the end of 2022 to 39.23% at the end of 2023, had a positive impact on the cost of funds.
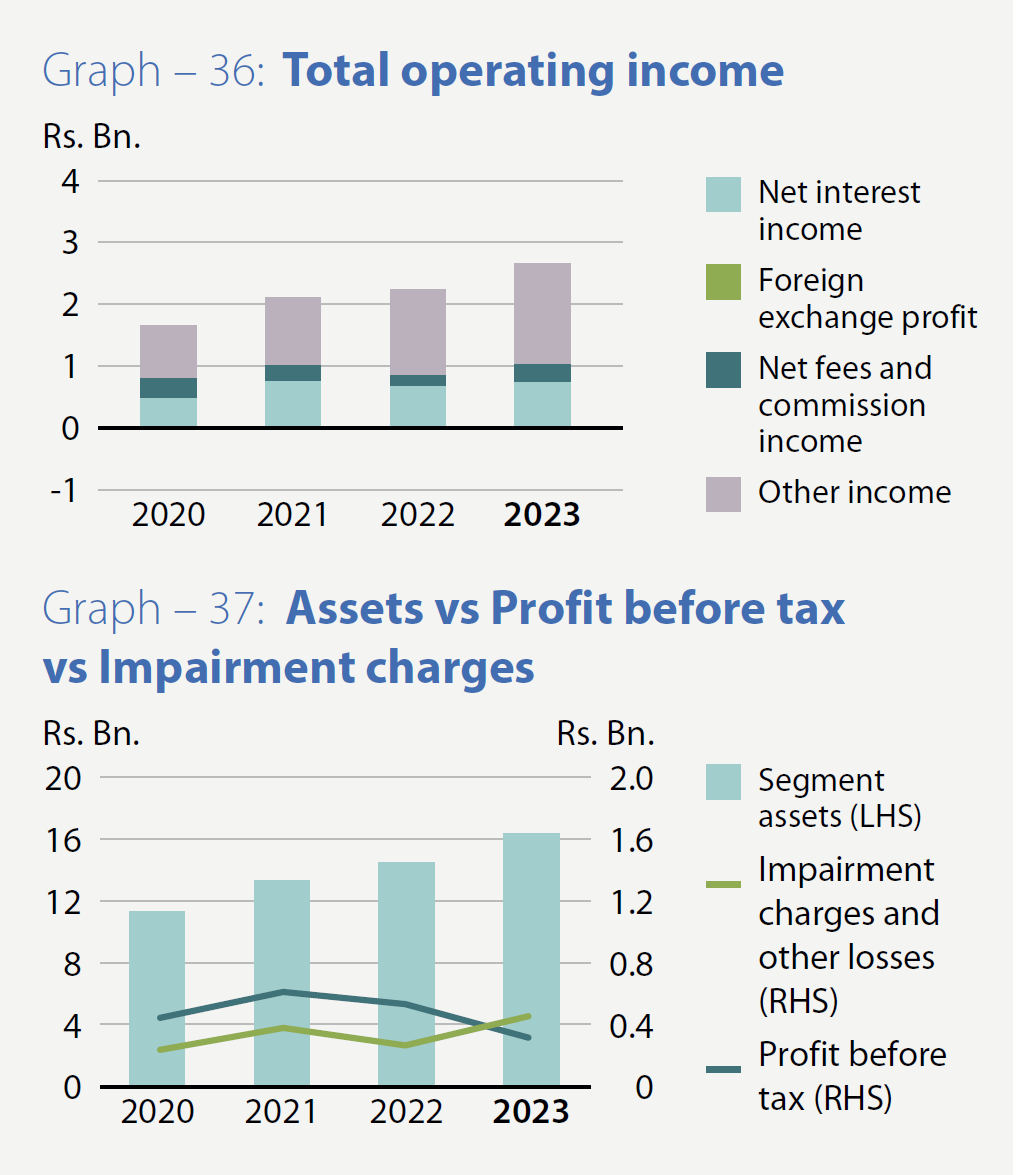
As a result, the Bank’s net interest income increased to Rs. 83.104 Bn. from Rs. 81.744 Bn. recorded in 2022, recording a marginal growth of 1.66% (compared to 26.52% in 2022) and represented 70.36% of the total operating income (compared to 61.51% in 2022). However, the Bank’s net interest margin, which indicates the difference between the return on interest-earning assets and the cost of funds of interest-bearing liabilities, declined by 73 bps to 2.82% in 2023 compared to 3.55% reported in 2022.
Fee-based operations
Fee and commission income reached Rs. 29.704 Bn., compared to Rs. 25.464 Bn. in 2022, reflecting a growth of 16.65% (compared to 65.24% in 2022). This increase was primarily driven by higher income from credit and debit card-related services and other financial services provided during the year.
Fee and commission expenses, primarily associated with credit and debit card-related services, rose to Rs. 8.146 Bn. from Rs. 5.973 Bn. in 2022, marking an increase of 36.39% (compared to 63.24% in 2022). Consequently, net fee and commission income increased to Rs. 21.558 Bn. compared to Rs. 19.491 Bn. in 2022, showing a growth of 10.60% (compared to 65.86% in 2022). This income accounted for 18.25% of the total operating income (compared to 14.67% in 2022).
Other income
The Bank’s total other income, consisting of net gains or losses from trading, net gains or losses from derecognition of financial assets and net other operating income, decreased by 57.52% to Rs. 13.448 Bn. for the year, compared to Rs. 31.653 Bn. reported in 2022 (which had seen a growth of 110.57%). The primary factor contributing to this decline was the significant exchange losses incurred by the Bank from swap/forward transactions due to the sharp appreciation of the Sri Lankan Rupee against the US Dollar, reaching Rs. 324.25 at the end of 2023 from Rs. 367.00 at the end of 2022, an appreciation of 13.18%. However, the impact of these losses was partially offset by exchange gains resulting from the revaluation of assets and liabilities.
Total operating income
Although there were improvements in both net interest income and net fee and commission income, the total operating income of the Bank declined to Rs. 118.109 Bn., representing a decrease of 11.12% compared to Rs. 132.888 Bn. reported in 2022 (which had experienced a growth of 45.40%). This decrease was primarily attributed to a substantial drop in other income by Rs. 18.205 Bn. or 57.52%, as explained previously.
Impairment charges and other losses
Impairment charges and other losses for the year decreased significantly to Rs. 38.624 Bn., down by Rs. 32.838 Bn. or 45.95% (as opposed to an increase of 189.41% in 2022) from Rs. 71.462 Bn. reported in 2022, which marked the highest provision ever made by the Bank for a single year in its history.
The substantial increase in 2022 was primarily attributed to the Bank setting aside Rs. 47.134 Bn. for foreign currency-denominated securities issued by the Government of Sri Lanka following the downgrade of the sovereign rating, along with an additional Rs. 24.150 Bn. allocated for individual and collective impairment provisions for loans and advances. This provision also included management overlays to address potential losses not captured by impairment models due to the prevailing high level of uncertainty and volatility throughout the year.
For the year under review, the impairment provision consisted of Rs. 33.830 Bn. for foreign currency-denominated securities issued by the Government of Sri Lanka and Rs. 5.690 Bn. for loans and advances.
Net operating income
The net operating income for the year rose to Rs. 79.486 Bn., marking an increase of 29.40% (as against a negative growth of 7.91% in 2022) from Rs. 61.427 Bn. reported in 2022. This increase was primarily driven by the decrease in impairment charges and other losses, which more than offset the negative growth in total operating income as explained earlier.
Operating expenses
Total operating expenses for the year amounted to Rs. 42.644 Bn., compared to Rs. 34.936 Bn. reported in 2022, marking an increase of Rs. 7.708 Bn., or 22.06% (compared to 20.92% in 2022). This increase was primarily driven by an increase in personnel expenses by 14.96% (compared to 17.10% in 2022), reaching Rs. 21.972 Bn. from Rs. 19.113 Bn. in 2022, due to salary increments and other staff related expenses. Additionally, other operating expenses for the year also increased by 33.68% (compared to 30.54% in 2022) to Rs. 16.389 Bn. from Rs. 12.260 Bn. in 2022, attributed to price hikes across various expense categories, exchange impact of the higher foreign currency-related payments for asset maintenance and increased indirect taxes. Depreciation and amortisation expenses also rose to Rs. 4.284 Bn., marking a 20.21% increase (compared to 12.11% in 2022), primarily due to investments made in IT-related assets.
Consequently, the Bank’s Cost to Income ratio (excluding taxes on financial services) for 2023 increased to 36.11% for the year from 26.29% in 2022.
Operating profit before taxes on Financial Services and taxes on Financial Services
Due to the growth in net operating income surpassing the increase in total operating expenses, as discussed earlier, the operating profit before taxes on Financial Services improved by 39.07% (as against the negative growth of 29.94% in 2022), reaching Rs. 36.842 Bn. from Rs. 26.491 Bn. in 2022.
Taxes on Financial Services rose to Rs. 4.961 Bn., marking a 27.47% increase (as against the negative growth of 33.00% in 2022) from Rs. 3.892 Bn. in 2022. This increase was attributed to the introduction of the Social Security Contribution Levy of 2.5% effective from October 1, 2022 and the rise in amount of the in value addition attributable to the supply of financial services in 2023.
Consequently, the Bank’s Cost to Income ratio (including taxes on financial services) for 2023 increased to 40.31% for the year from 29.22% in 2022.
Profit before and after taxes
Due to the increase in operating profit before taxes on financial services outpacing the growth in taxes on financial services, as explained earlier, the profit before taxes for the year increased to Rs. 31.880 Bn., recording a growth of 41.07% (as against the negative growth of 29.38% in 2022).
The income tax charge for the year amounted to Rs. 11.419 Bn., in contrast to a tax reversal of Rs. 0.371 Bn. in 2022. This reversal in 2022 was primarily due to an increase in deferred tax assets resulting from the change in the income tax rate to 30% effective from July 01, 2022, compared to the previous rate of 24%. The overall reversal in deferred tax exceeded the current tax liability for 2022, which was computed at two different income tax rates: 24% for the first half of the year and 30% for the second half of the year for the Bank’s operations in Sri Lanka. The tax rate for the Bank’s operations in Bangladesh remained at 40% for both years.
Consequently, the profit after tax for the year recorded a negative growth of 10.92% (compared to the negative growth of 2.70% in 2022) and amounted to Rs. 20.461 Bn., compared to Rs. 22.970 Bn. reported for 2022.
Profitability
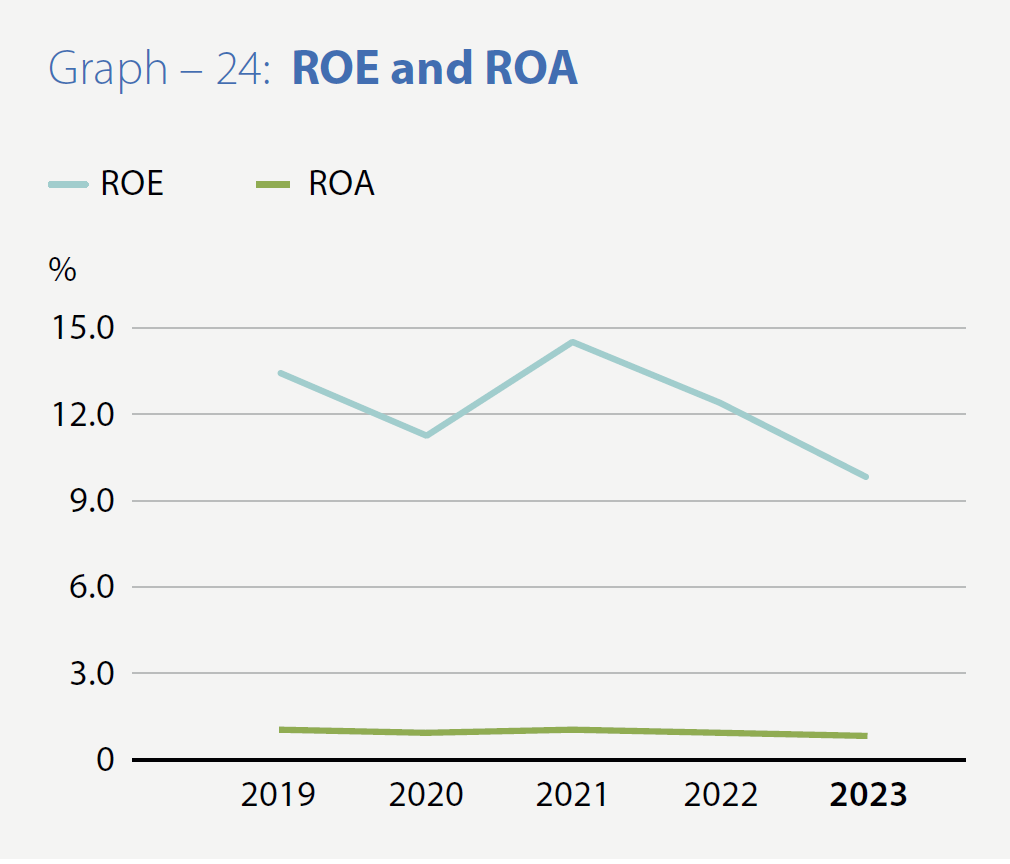
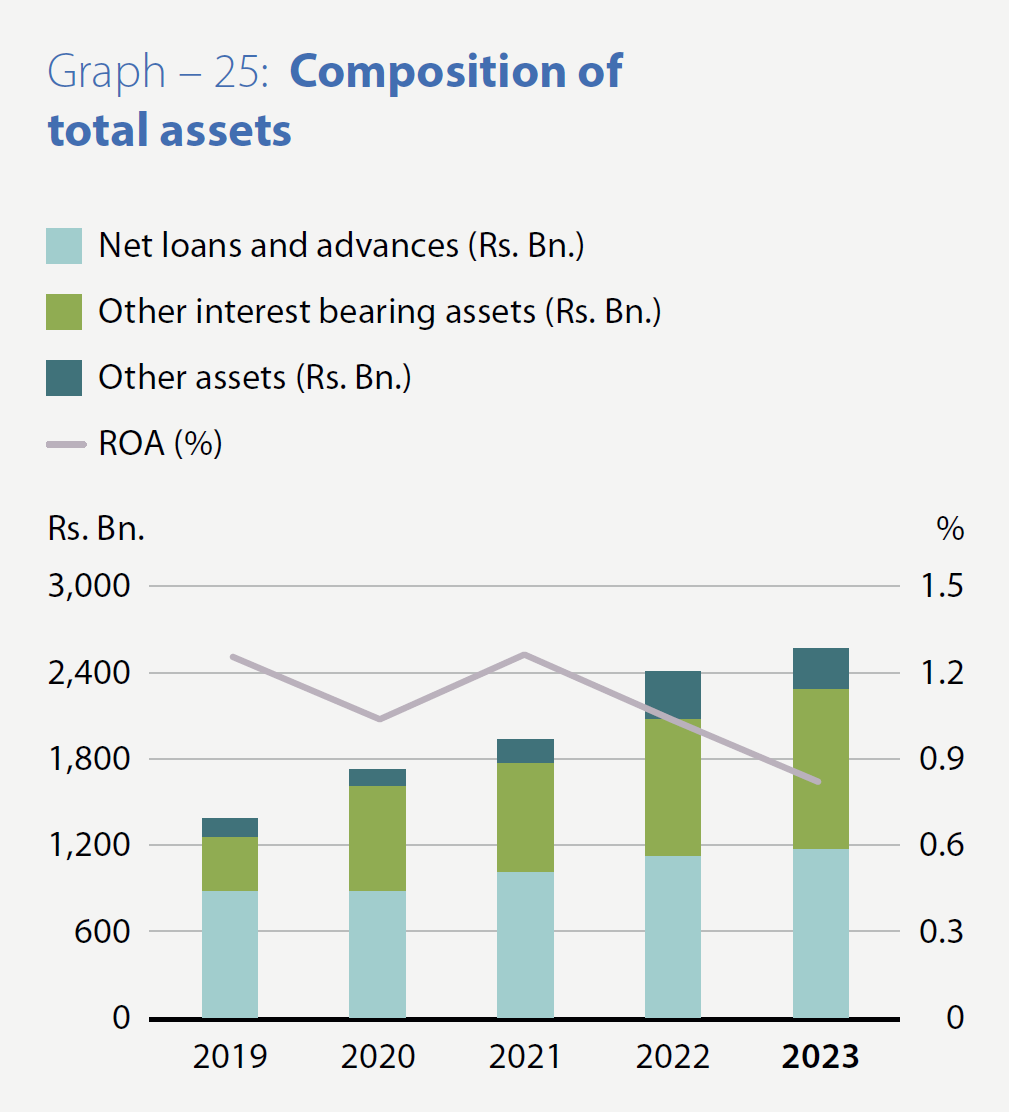
Reflecting the decline in profit after tax and the relatively higher growth in total assets and equity throughout the year, both the Return on Assets (ROA) and Return on Equity (ROE) decreased to 0.82% (compared to 1.05% in 2022) and 9.78% (compared to 12.46% in 2022) respectively.
However, the ROA (before tax) for the year increased to 1.27% (compared to 1.03% in 2022) due to the growth in profit before tax as explained earlier.
Other Comprehensive Income (OCI)
The Bank reported a loss of Rs. 8.465 Bn. in Other Comprehensive Income during the year, contrasting with a profit of Rs. 26.215 Bn. reported in 2022. This was primarily due to a loss of Rs. 11.086 Bn. (as against the gain of Rs. 14.877 Bn. in 2022) on the translation of financial statements of the Bank’s foreign operations. However, this loss for the year was partially offset by a net gain of Rs. 1.899 Bn. recognised fair valuation of investments in Financial Assets at Fair Value through Other Comprehensive Income (FVOCI), which was derived after discounting Rs. 3.542 Bn. recognised in profits as gains on disposal of financial assets at FVOCI during the year.
In contrast, in 2022, there was a reversal in fair value losses due to the reclassification of debt instruments from Fair Value through Other Comprehensive Income (FVOCI) to Amortised Cost (AC), amounting to Rs. 12.292 Bn. This was due to the Bank’s decision to reclassify a significant portion of its Treasury Bond Portfolio amounting to Rs. 197.075 Bn., Sri Lanka Development Bond (SLDB) portfolio amounting to Rs. 55.473 Bn. (USD 152.19 Mn.) and the entire Sri Lanka Sovereign Bond (SLSB) portfolio amounting to Rs. 39.596 Bn. (USD 108.63 Mn.) from the FVOCI category to AC category, effective from April 01, 2022, in line with the guidelines issued by the CA Sri Lanka in the form of a Statement of Alternative Treatment (SoAT) on “Reclassification of Debt Portfolio due to unprecedented changes in the macro-economic conditions”.
The aforementioned fair value loss of Rs. 12.292 Bn. comprised the cumulative losses that the Bank recognised (net of tax) in equity through OCI prior to the reclassification. Furthermore, the effect of the loss of Rs. 11.086 Bn. on the translation of financial statements of the Bank’s foreign operation for 2023 was partly offset by the net surplus on the revaluation of freehold land and buildings of the Bank, amounting to Rs. 1.012 Bn., recognised in equity through OCI.
In 2022, there was an increase in the deferred tax liability recognised on the cumulative surplus on the revaluation of freehold land and buildings of the Bank, amounting to Rs. 0.799 Bn., due to the increase in the income tax rate to 30% effective from July 2022 from the earlier income tax rate of 24%.
As a result, the total comprehensive income of the Bank for the year 2023 reduced to Rs. 11.996 Bn., compared to Rs. 49.185 Bn. reported in 2022, reflecting a negative growth of 75.61% (as against the growth of 281.24% in 2022).
Statement of Financial Position
In 2023, the Bank achieved two significant milestones, continuing its trend of pioneering achievements. Firstly, it became the first private sector bank in the country to exceed Rs. 2.5 Tn. in total assets, reinforcing its position as a leader in the banking sector. Secondly, it surpassed the Rs. 2 Tn. mark in deposits, further solidifying its status as the benchmark private sector bank in the country. These accomplishments add to the Bank’s legacy of being the first private sector bank to surpass the Rs. 1 Tn. mark in total assets (achieved in 2016), deposits (achieved in 2019) and loans and advances (achieved in 2021).
Assets
During the year, the Bank’s total assets grew by 6.37% (compared to 24.45% in 2022), reaching Rs. 2.580 Tn. from Rs. 2.426 Tn. at the end of the previous year. This growth significantly exceeded the industry’s asset growth of 2.16% (compared to 17.72% in 2022). This notable increase was primarily attributed to increased investments in Government Securities, driven by excess liquidity resulting from deposit growth outpacing the expansion of loans and advances.
However, it is important to note that the projected asset growth was hindered by the downward revaluation effect of the Bank’s assets and liabilities denominated in foreign currency. This was due to the sharp appreciation of the Rupee against the US dollar during the year, contrasting with the Rupee’s sharp depreciation against the US dollar witnessed during the previous year.
Loans and advances to customers
Reversing the trend observed in the first half of 2023, credit to the private sector increased during the latter part of the year. As of December 31, 2023, gross loans and advances amounted to Rs. 1.266 Tn., compared to Rs. 1.220 Tn. a year ago. The net loans and advances stood at Rs. 1.176 Tn. as of December 31, 2023, compared to Rs. 1.130 Tn. at the end of 2022, reflecting a growth of 4.06% (compared to 11.42% in 2022). Loans and advances accounted for 45.59% of total assets as of December 31, 2023, marginally lower than the 46.60% reported in 2022.
The Bank maintained its position as the largest lender to the SME sector in Sri Lanka. (see page 79 for details). Additionally, the gross loans and advances of the Bank’s operations in Bangladesh experienced a growth of 24.13% in 2023 (as against the negative growth of 11.27% in 2022) in BDT terms.
Asset quality
The quality of loans and advances serves as a critical factor in assessing the sustainability of the Bank’s operations. Despite challenging macro-economic conditions that prevailed in the country in 2023, the Bank maintained a conservative risk profile, coupled with a moderate risk appetite and a robust risk management framework. This approach resulted in both the net impaired loans (Stage 3) to total loans and advances ratio (including undrawn commitments) and impaired loans (Stage 3) to total loans and advances ratio (excluding undrawn commitments) standing at 5.85% (2022: 5.25%) and 11.34% (2022: 9.41%), respectively, by the end of 2023. These figures compare favourably to industry averages of 13.56% (2022: 11.26%) and 13.41% (2022: 11.61%), respectively, indicating the Bank’s prudent risk management practices. Although there was a deterioration in both the above ratios in 2023 due to the unprecedented macro-economic conditions that prevailed in the country, it is worth noting that both ratios remain within acceptable levels when compared to industry averages.
Additionally, the impairment (Stage 3) to Stage 3 loans ratio (Stage 3 impairment coverage ratio) and the cumulative impairment provisions for loans and advances as a percentage of the total loans and advances (total impairment coverage ratio) stood at 44.03% (2022: 40.42%) and 7.05% (2022: 7.32%), respectively, by the end of 2023. These figures, though showing a slight deterioration compared to the previous year, remain acceptable compared to industry averages. The Bank continued to review and adjust the stage assessment criteria for loans and advances to accurately reflect the associated risks with customers.
Moreover, the open credit exposure ratio, representing the net exposure on Stage 3 loans as a percentage of regulatory capital, stood at 38.69% at the end of 2023 (2022: 34.41%) compared to industry averages of 45.39% (2022: 44.00%), indicating prudent risk management practices in mitigating credit risks.
Furthermore, the Bank’s loans to customers portfolio is well diversified across various industry sectors, with no significant exposure to any particular sector, ensuring resilience against sector-specific risks. Additional details regarding the sector-wise distribution of loans to customers can be found on page 328.
Deposits
With our solid franchise, customer deposits continued to remain the primary source of funding for the Bank, constituting 80.81% of the total assets as of December 31, 2023 (2022: 78.92%), compared to the industry average of 80.97% (2022: 78.79%). Deposits grew by 8.92% to reach Rs. 2.085 Tn. by the end of 2023, compared to the growth rate of 32.66% in 2022, which was influenced by the sharp depreciation of the Rupee against the US Dollar during that period. The growth in deposits for the year amounted to Rs. 170.687 Bn.
Despite these challenges, the Bank’s CASA ratio marginally improved to 39.23% as of December 31, 2023, compared to 38.36% in 2022, which is considered the industry best compared to the industry average of 30.61% in 2023 (2022: 31.18%).
Other liabilities
The substantial increase in deposit liabilities compared to the relatively lower growth in loans and advances resulted in the Bank having excess liquidity throughout the year. Total other liabilities at the year-end amounted to Rs. 280.351 Bn., compared to Rs. 307.740 Bn. at the end of 2022. During the year, the Bank raised Rs. 12.000 Bn. through the issuance of BASEL III compliant debentures (compared to Rs. 10.000 Bn. in 2022), while BASEL III compliant debentures worth Rs. 8.294 Bn., issued in 2018 were matured during the year (2022: Nil). Additionally, the Bank successfully settled borrowings from IFC amounting to Rs. 24.100 Bn. in March 2023 obtained in March 2013 to strengthen Tier II Capital.
Capital
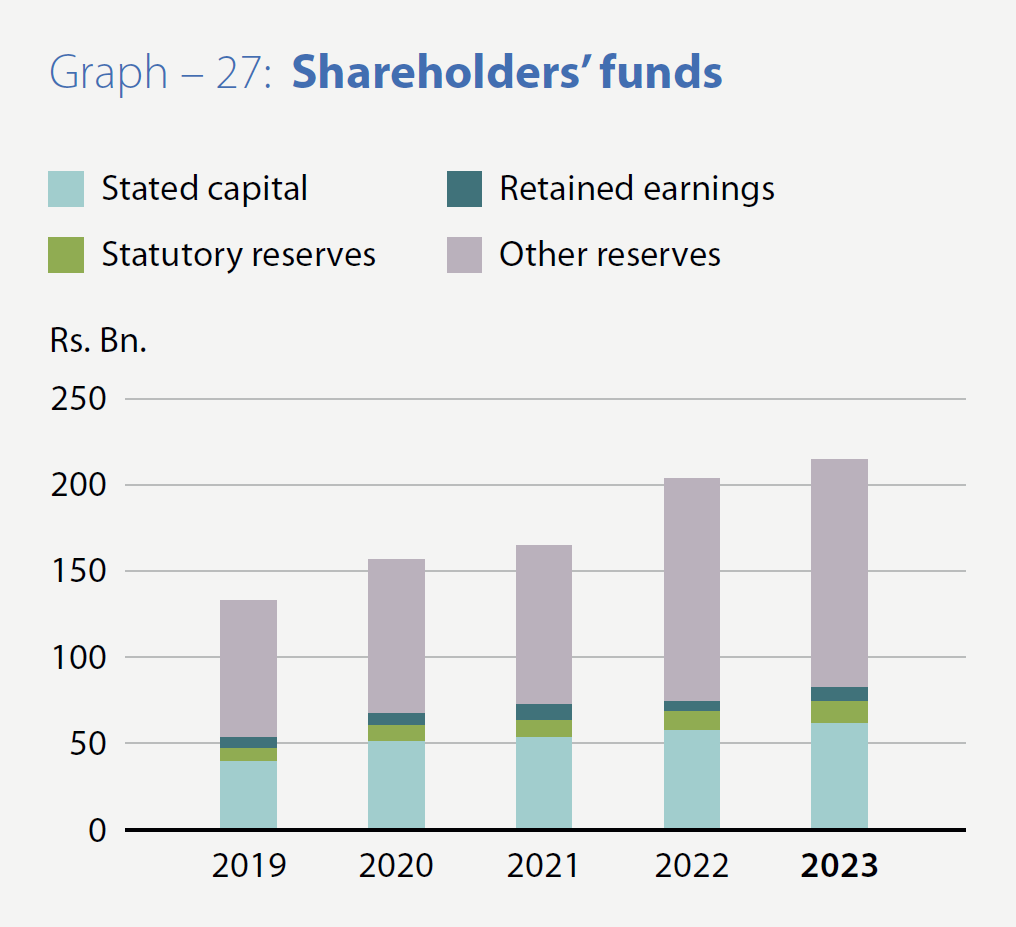
The Bank is guided by its Internal Capital Adequacy Assessment Process (ICAAP), Capital Augmentation Plan and the Board-approved dividend policy to maintain capital levels aligned with its current and projected business growth. Consequently, supported by the total comprehensive income for the year and the prudent dividend policy, the Bank increased its equity capital by 5.51% (2022: 23.53%) to Rs. 214.931 Bn. as of December 31, 2023, compared to Rs. 203.699 Bn. as of December 31, 2022. With an on-balance sheet multiplier (gearing ratio) of 12.01 times (2022: 11.91 times), equity funded 8.33% (2022: 8.40%) of total assets as of the current year-end, compared to industry averages of 11.52 times (2022: 12.15 times) and 8.68% (2022: 8.23%) respectively. The Bank ploughed back Rs. 12.660 Bn., from the profit for the year 2022 after the payment of one-off surcharge tax and dividends.
The risk-weighted assets of the Bank increased by 1.12% to Rs. 1.371 Tn. as of December 31, 2023, from Rs. 1.356 Tn. as of the end of 2022. Consequently, both the Tier 1 and total capital ratios stood at 11.442% (2022: 11.389%) and 15.151% (2022: 14.657%) respectively, as of December 31, 2023, exceeding the minimum requirements of 10.000% and 14.000% respectively, for 2023. These ratios demonstrate the Bank’s compliance with the higher capital adequacy requirements as a Domestic Systemically Important Bank (D-SIB) under Basel III regulations. The equity multiplier, in terms of risk-weighted assets to regulatory total capital, decreased to 6.60 times from 6.82 times a year ago.
Under the CBSL Basel III regulations, the Bank is classified as one of the highest-graded D-SIBs, highlighting its significance to the Sri Lankan economy.
Liquidity
The growth in deposits continued to surpass the growth in loans and advances during the current year as well, prompting the Bank to invest excess liquidity in Government securities. Despite unprecedented volatility, excess liquidity offers a high level of reassurance to the Bank and positions it to capitalise on anticipated increases in credit demand in the future. Given its significance, liquidity review remains a permanent agenda item in the Bank’s fortnightly ALCO meetings. The consolidated liquid assets ratio of the Bank’s Sri Lankan operations stood at 46.06% (2022: 35.88%), compared to the statutory minimum requirement of 20%.
The gross loans to deposits ratio was 60.70% (2022: 63.71%). Available stable funding, as defined by the CBSL, amounted to Rs. 1.933 Tn. as of December 31, 2023 (2022: Rs. 1.768 Tn.), leading to a Net Stable Funding Ratio (NSFR) of 193.70% (2022: 173.58%), comfortably above the statutory minimum of 100% for 2023 (2022: 90%). This underscores the Bank’s ability to meet its long-term funding requirements.
Moreover, the Liquidity Coverage Ratio (LCR) for all currencies and LCR for the Rupee stood at 516.27% (2022: 293.91%) and 491.61% (2022: 405.91%) respectively, as of December 31, 2023, well exceeding the statutory minimum of 100% (2022: 90%) for both ratios for 2023. These ratios highlight the Bank’s ample supply of unencumbered high-quality liquid assets, ensuring its ability to withstand short-term liquidity disruptions.
Segmental performance
The Corporate and the Personal Banking Divisions made a significant contribution to the Group’s profit before tax in 2023, primarily driven by a reduction in impairment charges and other losses. The International Operations too enhanced its contribution to the Group’s profit before tax during the year, largely attributed to rises in net interest income and foreign exchange profits. However, the Treasury Division of the Bank experienced a substantial loss for the year 2023, albeit lower than the previous year, mainly due to additional impairment provisions related to USD-denominated Government Securities following the downgrade of the country’s sovereign rating and the impact of interest rate volatility on the Funding Centre being borne by the Treasury.
For a detailed analysis of segmental performance, please refer to pages 126 and 127 and the Note 61 to the Financial Statements on Operating Segments.
Quarterly financial performance and the financial position of both the Group and the Bank for 2023 and 2022 can be found on pages 132 to 137, while the Bank’s performance in terms of key indicators over the past 10 year period is given in the “Decade at a Glance” section.
The Financial Soundness Indicators presented below offer valuable insights into the financial robustness and stability of the Bank.
Core Financial soundness indicators (FSIs)
Table - 22| Financial soundness indicator (%) | 2023 | 2022 | 2021 | 2020 | 2019 |
| Capital Adequacy (under Basel III) | |||||
| Common equity Tier 1 ratio (current minimum requirement – 8.5%) | 11.44 | 11.39 | 11.92 | 13.22 | 12.30 |
| Tier 1 capital ratio (current minimum requirement – 10%) | 11.44 | 11.39 | 11.92 | 13.22 | 12.30 |
| Total Capital Ratio (current minimum requirement – 14%) | 15.15 | 14.66 | 15.65 | 16.82 | 16.15 |
| Asset quality: | |||||
| Impaired loans (Stage 3) ratio (based on existing regulatory provisions which includes undrawn commitments) |
5.85 | 5.25 | 3.85 | 6.78 | N/A |
| Impairment (Stage 3) to Stage 3 loans ratio (based on existing regulatory provisions which includes undrawn commitments) |
43.22 | 39.60 | 42.76 | 30.87 | N/A |
| Total impairment coverage ratio | 7.05 | 7.32 | 5.94 | 5.38 | 3.89 |
| Cost of credit risk | 0.45 | 1.80 | 1.35 | 1.88 | 1.09 |
| Open credit exposure ratio (Net exposure on NPCFs as a % regulatory capital) | 38.69 | 34.41 | 25.33 | N/A | N/A |
| Non-performing credit facilities (NPCFs) – (net of impairment) to equity | 37.38 | 33.56 | 26.69 | N/A | N/A |
| Earnings and profitability: | |||||
| Net interest income to total operating income | 70.36 | 61.51 | 70.69 | 66.15 | 71.51 |
| Net fee and commission income to total operating income | 18.25 | 14.67 | 12.86 | 12.35 | 15.59 |
| Other income to total operating income | 11.39 | 23.82 | 16.45 | 21.50 | 12.91 |
| Operating expenses to gross income | 12.70 | 12.68 | 17.96 | 16.99 | 17.10 |
| Impairment charge to total operating income | 32.70 | 53.78 | 27.02 | 28.67 | 16.76 |
| Cost to income ratio (including taxes on financial services) | 40.31 | 29.22 | 37.97 | 39.96 | 49.41 |
| Cost to income ratio (excluding taxes on financial services) | 36.11 | 26.29 | 31.61 | 33.95 | 38.51 |
| Financial intermediation margin (gross income to average assets) | 13.41 | 12.59 | 8.73 | 9.59 | 11.05 |
| Interest margin (net interest income to average assets) | 3.32 | 3.74 | 3.51 | 3.17 | 3.51 |
| Return on assets (ROA) – before income tax | 1.27 | 1.03 | 1.74 | 1.51 | 1.66 |
| Return on assets (ROA) – after income tax | 0.82 | 1.05 | 1.28 | 1.05 | 1.27 |
| Return on equity (ROE) | 9.78 | 12.46 | 14.66 | 11.28 | 13.54 |
| Liquidity: | |||||
| Statutory liquid assets ratio (consolidated – Sri Lankan Operations) – (current minimum requirement – 20%) |
46.06 | 35.88 | N/A | N/A | N/A |
| Liquidity coverage ratio (LCR) – Rupee – (current minimum requirement – 100%) | 491.61 | 405.91 | 425.97 | 599.38 | 158.79 |
| Liquidity coverage ratio (LCR) – All currency – (current minimum requirement – 100%) | 516.27 | 293.91 | 242.52 | 422.86 | 224.74 |
| Net Stable funding ratio (NSFR) – (current minimum requirement – 100%) | 193.70 | 173.58 | 157.47 | 157.49 | 137.05 |
| CASA ratio (current and saving deposits as a % of total deposits) | 39.23 | 38.36 | 47.83 | 42.72 | 37.10 |
| Gross loans and advances to deposits ratio | 60.70 | 63.71 | 74.75 | 74.87 | 87.39 |
| Assets and funding structure: | |||||
| Deposits to gross loans and advances | 164.75 | 156.96 | 133.78 | 133.56 | 114.43 |
| Deposits to total assets | 80.81 | 78.92 | 74.03 | 72.92 | 75.92 |
| Borrowings to total assets | 1.91 | 3.20 | 3.64 | 5.35 | 4.41 |
| Equity to total assets | 8.33 | 8.40 | 8.46 | 9.05 | 9.60 |
Segmental analysis
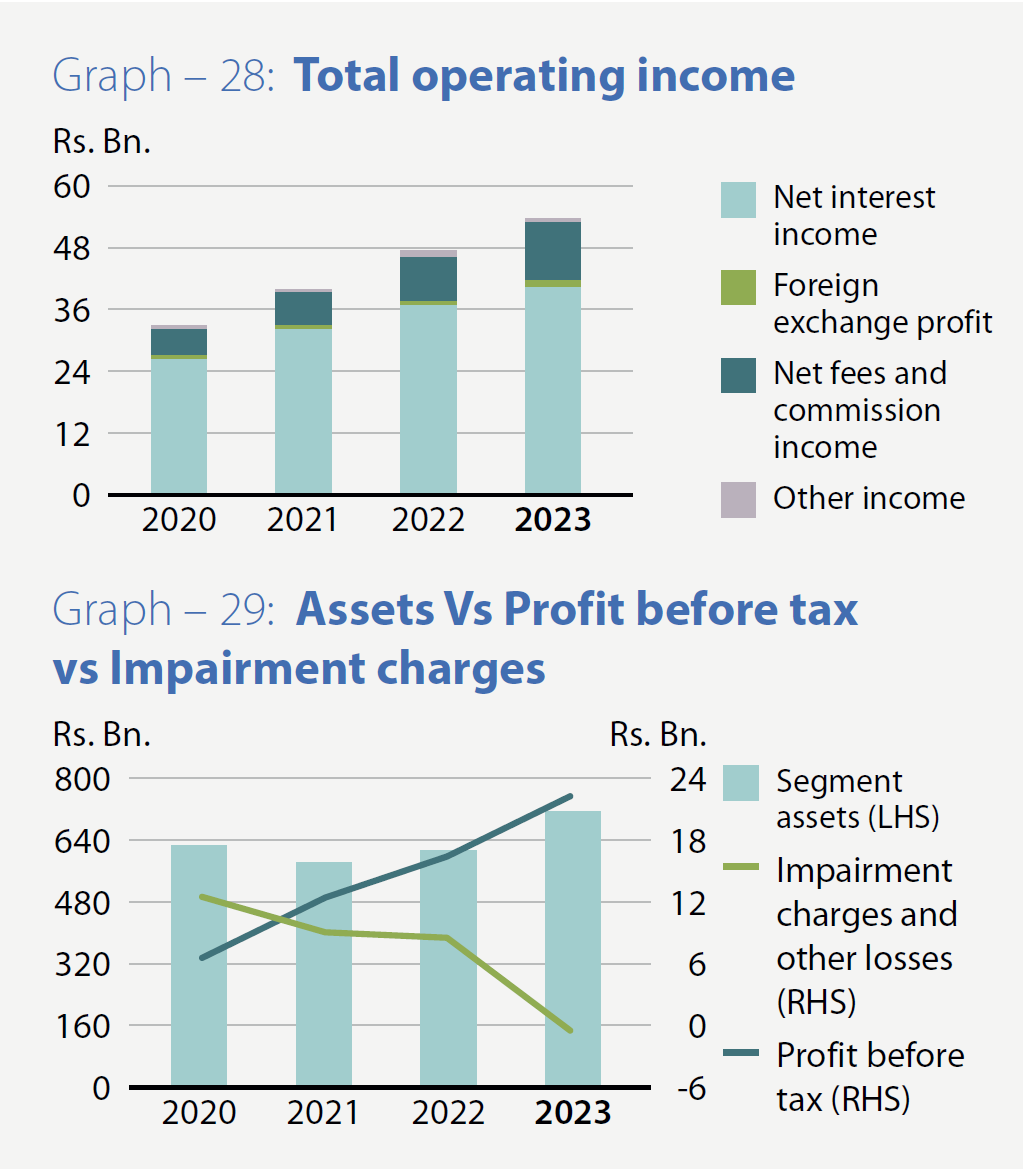
Personal banking
- Highest contributor to the Group in terms of net interest income, net fee and commission income and net operating income.
- Total operating income increased by 13.39% to Rs. 53.652 Bn., contributing almost 44% to the Group.
- Profit before tax increased by 35.97% to Rs. 22.335 Bn.
- Accounted for more than one fourth of the assets of the Group as at end of 2023.
- Impairment charges decreased by 108.16% mainly due to the reversal in impairment provisions consequent to the revision of the Economic Factor Adjustment (EFA) in line with the latest available macro economic forecasts.
| Rs. Bn. | 2023 | 2022 | Change | Change as a % |
| Net interest income | 40.715 | 36.988 | 3.727 | 10.08 |
| Foreign exchange profit | 0.604 | 0.385 | 0.219 | 56.88 |
| Net fee and commission income | 11.802 | 9.214 | 2.588 | 28.09 |
| Other income | 0.532 | 0.729 | (0.197) | (27.02) |
| Total operating income | 53.652 | 47.316 | 6.336 | 13.39 |
| Impairment charges and other losses | 0.702 | (8.602) | 9.304 | (108.16) |
| Net operating income | 54.354 | 38.714 | 15.640 | 40.40 |
| Profit before tax | 22.335 | 16.427 | 5.908 | 35.97 |
| Segment assets | 716.364 | 620.050 | 96.314 | 15.53 |
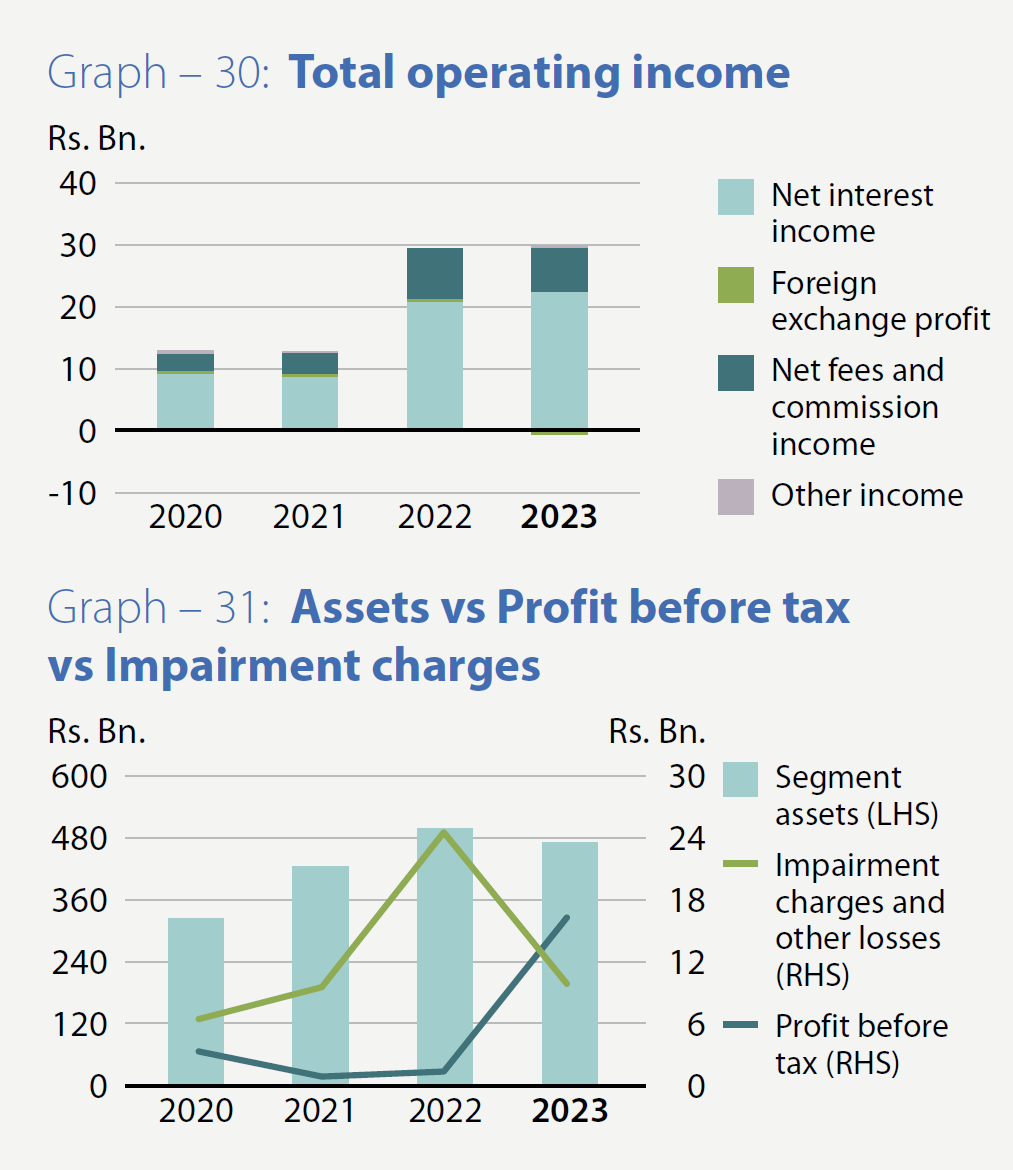
Corporate banking
- Net operating income and profit before tax increased to Rs. 19.179 Bn. and Rs. 16.561 Bn., respectively with significant increases of 403.39% and 1,408.29% respectively. The main contributory factor for the above increases was the decrease in impairment charges and other losses by 61.37% as a result of the reversal in impairment provisions consequent to revision of the Economic Factor Adjustment (EFA) in line with the latest available macro economic forecasts.
- Accounted for almost one fifth of the assets of the Group as at end of 2023.
| Rs. Bn. | 2023 | 2022 | Change | Change as a % |
| Net interest income | 21.869 | 20.629 | 1.240 | 6.01 |
| Foreign exchange profit | (0.460) | 0.121 | (0.581) | (480.17) |
| Net fee and commission income | 7.094 | 8.017 | (0.923) | (11.51) |
| Other income | 0.306 | (0.029) | 0.335 | (1,155.17) |
| Total operating income | 28.808 | 28.739 | 0.069 | 0.24 |
| Impairment charges and other losses | (9.629) | (24.928) | 15.299 | (61.37) |
| Net operating income | 19.179 | 3.810 | 15.369 | 403.39 |
| Profit before tax | 16.561 | 1.098 | 15.463 | 1,408.29 |
| Segment assets | 472.431 | 498.406 | (25.975) | (5.21) |
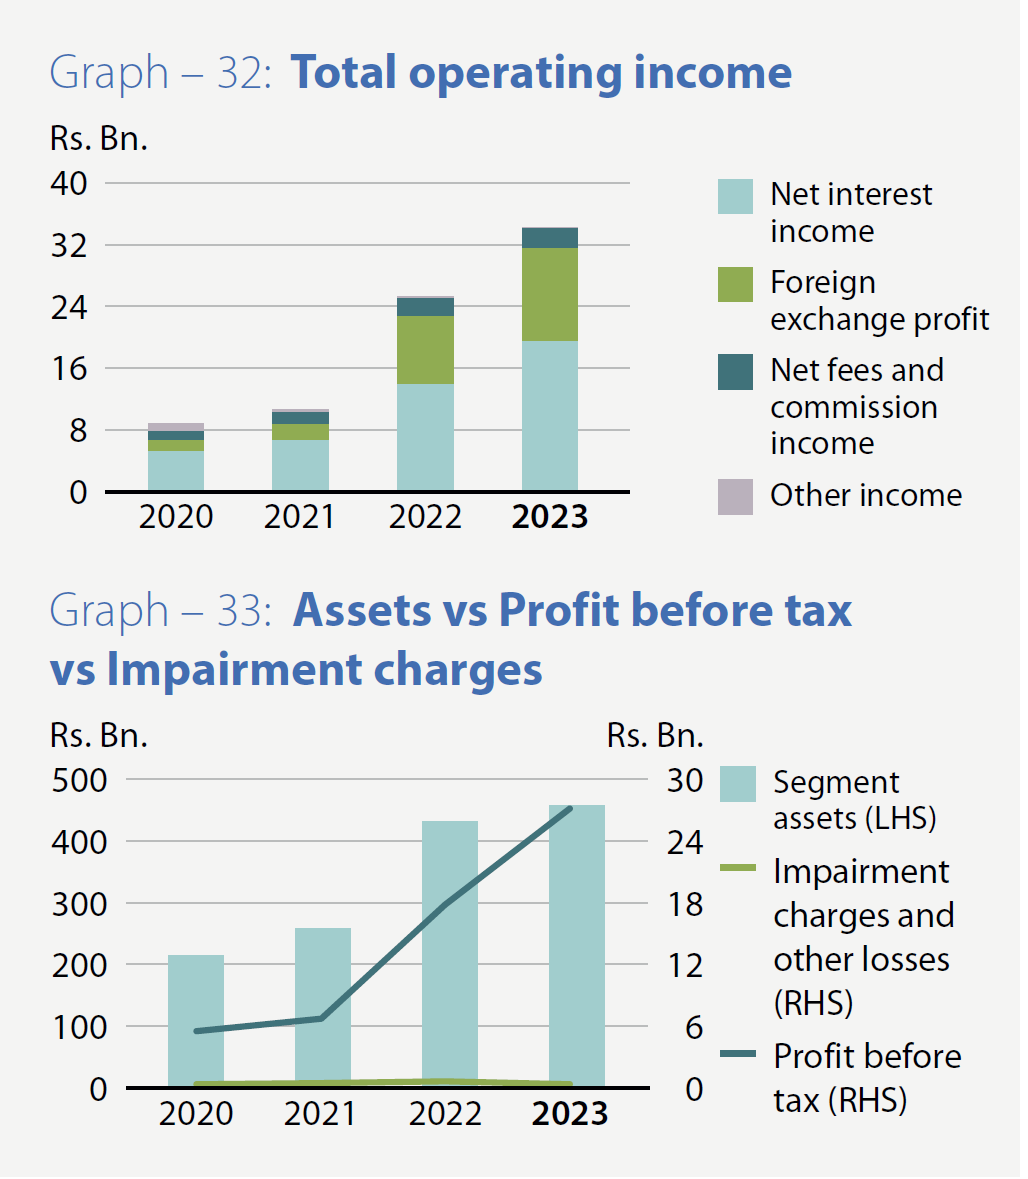
International operations
- Significant increases reported in net interest income and foreign exchange profit by 40.35% and 35.75% respectively.
- Highest contributor to the Group's foreign exchange profit amounting to Rs. 11.888 Bn., mainly due to the net exchange profit reported on revaluation of FCY denominated assets and liabilities of the Bangladesh operations.
- Total operating income increased by 35.29% to Rs. 34.282 Bn.
- The Bangladesh operation of the Bank made a noteworthy contribution of 91.95% of the profit before tax of international operations while having the highest asset base within the segment.
- Profit recorded by Commercial Bank of Maldives Private Limited for the year is the highest profit achieved by the Company during its 7-year history.
| Rs. Bn. | 2023 | 2022 | Change | Change as a % |
| Net interest income | 19.720 | 14.051 | 5.669 | 40.35 |
| Foreign exchange profit | 11.888 | 8.757 | 3.131 | 35.75 |
| Net fee and commission income | 2.576 | 2.387 | 0.189 | 7.92 |
| Other income | 0.098 | 0.145 | (0.047) | (32.41) |
| Total operating income | 34.282 | 25.339 | 8.943 | 35.29 |
| Impairment charges and other losses | (0.239) | (1.091) | 0.852 | (78.09) |
| Net operating income | 34.043 | 24.248 | 9.795 | 40.40 |
| Profit before tax | 26.654 | 17.424 | 9.230 | 52.97 |
| Segment assets | 449.873 | 422.835 | 27.038 | 6.39 |
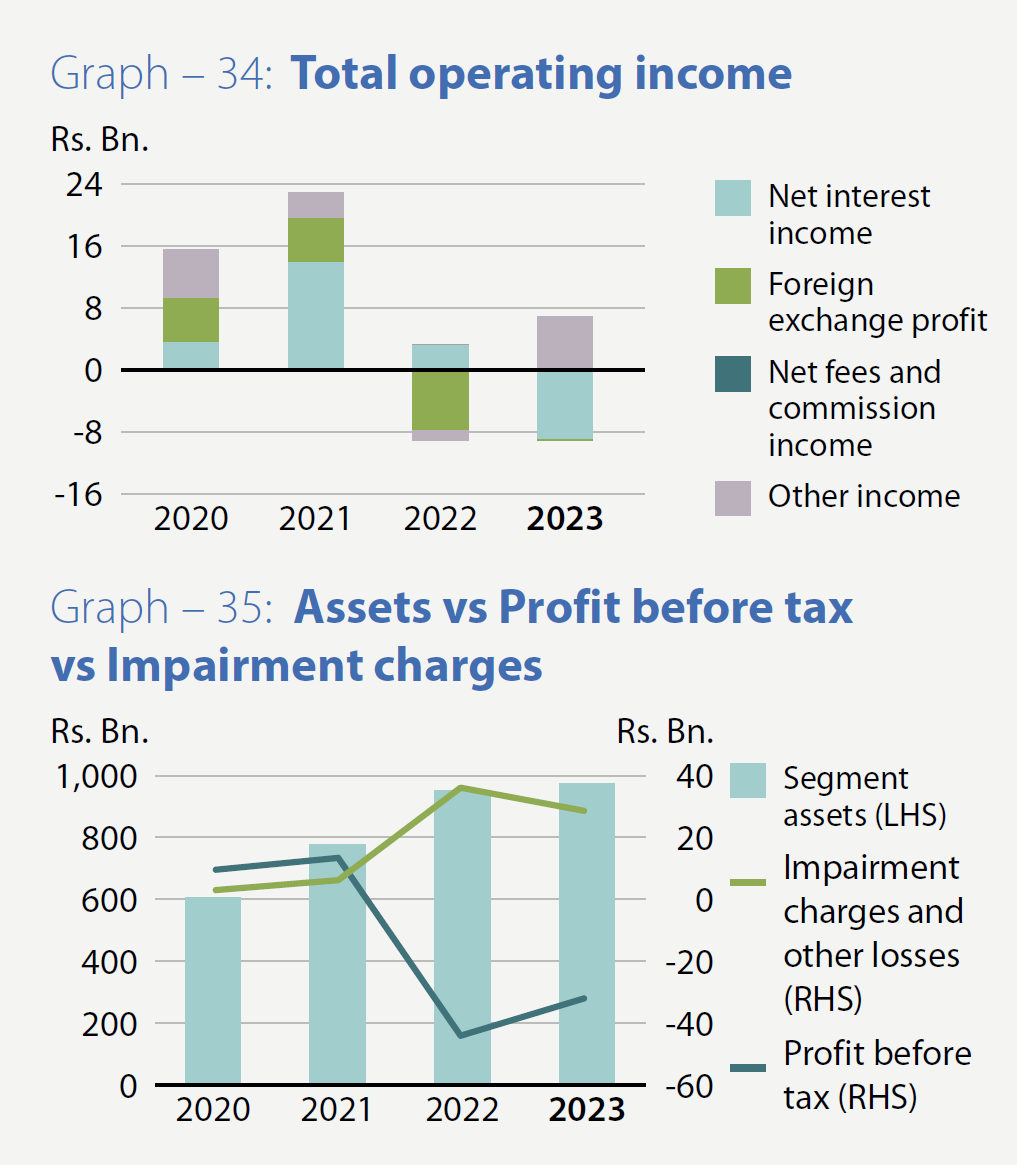
Dealing/Treasury
- Highest contributor (36.47%) to the Group's total assets of Rs. 2.656 Tn., mainly due to excess liquidity being invested in treasury related products consequent to subdued demand for loans and advances.
- Other income of Rs. 6.821 Bn., highest within the Group, which was generated mainly due to the capital gains on realisation of Government securities.
- Considerable decrease in foreign exchange losses ( 98.48%) compared to previous year.
- Impairment charges and other losses reduced by 21.06% to Rs. 29.249 Bn.
| Rs. Bn. | 2023 | 2022 | Change | Change as a % |
| Net interest income | (8.945) | 3.214 | (12.159) | (378.31) |
| Foreign exchange profit | (0.119) | (7.823) | 7.704 | (98.48) |
| Net fee and commission income | 0.024 | 0.008 | 0.016 | 200.00 |
| Other income | 6.821 | (1.343) | 8.164 | (607.89) |
| Total operating income | (2.218) | (5.944) | 3.726 | (62.69) |
| Impairment charges and other losses | (29.249) | (37.053) | 7.804 | (21.06) |
| Net operating income | (31.467) | (42.997) | 11.530 | (26.82) |
| Profit before tax | (32.237) | (44.857) | 12.620 | (28.13) |
| Segment assets | 968.516 | 945.053 | 23.463 | 2.48 |
NBFI, Real Estate & Services
- Commercial Development Company PLC (CDC) was the main contributor in terms of profit before tax due to the increase in fair value gains recognised on investment properties.
- Impairment charges and other losses increased by 92.77%, mainly due to higher impairment charges provided by CBC Finance Ltd (CBCF).
- While accepting the challenge of growing the portfolios in an unprecedented market, CBCF’s total assets increased from 13.73%, with a growth in loans and advances portfolio.
| Rs. Bn. | 2023 | 2022 | Change | Change as a % |
| Net interest income | 0.755 | 0.679 | 0.076 | 11.19 |
| Foreign exchange profit | (0.002) | 0.002 | (0.004) | (200.00) |
| Net fee and commission income | 0.290 | 0.180 | 0.110 | 61.11 |
| Other income | 1.610 | 1.369 | 0.241 | 17.60 |
| Total operating income | 2.653 | 2.230 | 0.423 | 18.97 |
| Impairment charges and other losses | (0.480) | (0.249) | (0.231) | 92.77 |
| Net operating income | 2.173 | 1.981 | 0.192 | 9.69 |
| Profit before tax | 0.300 | 0.542 | (0.242) | (44.65) |
| Segment assets | 16.484 | 14.566 | 1.918 | 13.17 |
Performance of the overseas operations, subsidiaries and the associate
Performance of the Bank’s Bangladesh Operations
The performance of the Bank’s operations in Bangladesh (CBC Bangladesh) will have to be reviewed in conjunction with the Operating Context and Outlook section of this report.
Commencing its operations in Bangladesh in November 2003 by acquiring the banking business of Credit Agricole Indosuez, CBC Bangladesh has emerged as a leading player in the country’s banking sector over the past two decades. With a network comprising 20 operating units, including 11 branches, a sub-branch, six SME centers and two offshore banking units, CBC Bangladesh has established a strong foothold in the market. CBC Bangladesh has strategically positioned itself as a premier regional bank, focusing on corporate banking, consumer banking, treasury management and digital banking.
By the end of 2023, CBC Bangladesh possessed a total of 23 ATM machines, inclusive of seven in off-site locations. Additionally, at its Motijheel Branch, an Automated Banking Centre (ABC) has been established, featuring a real-time Cash Deposit Machine, Cheque Deposit Machine, KIOSK machine and digital signage.
CBC Bangladesh has achieved recognition as the top-performing regional bank, excelling in deposits, advances and profitability. This success stems from its commitment to delivering excellent service and fulfilling its commitments, with a focus on the following areas:
Corporate Banking:
In the domain of corporate banking, CBC Bangladesh has solidified its reputation as a premier regional bank since its inception. It has achieved this by delivering exceptional relationship banking services to corporate clients, resulting in a significant expansion of its corporate banking portfolio.
Consumer Banking:
In the realm of consumer banking, CBC Bangladesh aims to emerge as the preferred provider of retail, SME and credit card services for its target market. It intends to achieve this goal by leveraging a superior IT platform and offering innovative products. These efforts are directed towards cultivating a healthy deposit mix anchored by a robust savings base.
Treasury Management:
In the sphere of treasury management, CBC Bangladesh ensures consistent and efficient fund management. Leveraging superior expertise, it offers a range of diversified and innovative treasury products.
Digital Banking:
In the digital banking arena, CBC Bangladesh has launched innovative products, including the unique Digital Banking Product - the e-passbook. CBC Bangladesh also introduced PayMaster for corporate clients, ensuring smooth daily operations. Additionally, CBC Bangladesh has implemented a Two Factor Authentication system for online transactions, along with e-statements and Over the Air PIN (OTAP) for Credit Cards and Internet Banking, incorporating various innovative features.
Human resources:
CBC Bangladesh stands out as one of the most preferred employers in the banking industry. It has achieved this by offering excellent opportunities for training and development, introducing top-tier banking education programmes and fostering a healthy corporate environment.
Currently, CBC Bangladesh operates in five key districts across the country: Dhaka, Chittagong, Sylhet, Narayanganj and Gazipur. Despite facing stiff competition from both international and large local banks, CBC Bangladesh has consistently grown its business volumes. This growth is primarily attributed to its focus on serving multinationals and large local corporates with superior services and commitments. By expanding its branch network, CBC Bangladesh has successfully attracted more SME and retail clients, thus enhancing its low-cost deposit base, reducing the cost of funds and improving profitability.
In 2023, CBC Bangladesh upgraded its Internet Banking System with several innovative features, some of which were introduced for the first time in Bangladesh. These enhancements included the implementation of e-Leave and e-Attendance Systems, a revamp of the Corporate Website and the integration with the National Payment System Bangladesh (NPSB). Additionally, CBC Bangladesh introduced a Call Centre Solution and incorporated various new features to enhance its existing products and services.
In 2023, CBC Bangladesh received numerous awards and recognitions, including:
- Best Foreign Bank in Bangladesh – 2023 for the 4th consecutive year by Global Economic Limited, a UK-based magazine.
- Most Recommended Foreign Bank in Bangladesh – 2023 for the 3rd consecutive year by World Business Outlook, a Singapore-based magazine.
- Most Sustainable Bank in Bangladesh – 2023 for the 3rd consecutive year by International Business Magazine, UAE.
- Best Corporate Bank Bangladesh – 2023 for the 2nd consecutive year by Global Business Review Magazine, UAE.
- Best Foreign Bank in Bangladesh – 2023 by Global Business and Finance Magazine, USA.
- Most Innovative Foreign Banking Brand – Bangladesh – 2023 by Global Brand Magazine, UK.
- Bangladesh International Trade Finance Bank of the Year by Asian Banking & Finance Magazine, Singapore.
- Top Fastest Growing Companies to watch by Biz Tech Outlook, USA.
- Most Innovative Companies Focused on Changing the Future 2023 by The CIO Times Magazine, USA.

A significant highlight of the year was the recognition of Mr Najith Meewanage, Chief Executive Officer of CBC Bangladesh Operations, as one of the Top 10 Best Business Leaders in Bangladesh for 2023 by CEO Insights Magazine, India.
CBC Bangladesh also received a special commendation letter from the Central Bank of Bangladesh for fully disbursing the allocated stimulus package to the SME sector in 2022. Additionally, the Large Tax Payer Unit (LTU) of the National Board of Revenue (NBR), Bangladesh, recognised CBC Bangladesh with an award for being one of the highest taxpayers in the country.
Meanwhile, the Credit Rating Information and Services Ltd. (CRISL) rated CBC Bangladesh operations AAA for the 13th consecutive year based on the financial performance for 2022.
The progress of CBC Bangladesh operations in core banking areas over the past five years is given below:
Key Performances Indicators – Bangladesh Operations (based on management accounts)
Table - 23| Indicator | 2023 BDT Bn. |
2022 BDT Bn. |
2021 BDT Bn. |
2020 BDT Bn. |
2019 BDT Bn. |
5-Year CAGR (%) |
| Total deposits | 96.917 | 71.243 | 64.959 | 50.997 | 45.363 | 22.44 |
| Gross advances | 64.002 | 51.56 | 58.111 | 55.039 | 47.450 | 10.73 |
| Profit before tax | 8.792 | 5.424 | 3.035 | 2.898 | 2.745 | 29.22 |
| Profit after tax | 4.663 | 2.954 | 1.744 | 1.709 | 1.697 | 27.07 |
Key Financial Ratios – Bangladesh Operations (based on management accounts)
Table - 24| Indicator | 2023 | 2022 | 2021 | 2020 | 2019 |
| Cost/Income ratio (%) | 13.37 | 16.47 | 23.68 | 24.76 | 24.74 |
| Net interest margin (%) | 5.03 | 4.05 | 3.21 | 4.01 | 4.27 |
| Profit per employee (BDT Mn.) | 24.76 | 16.95 | 10.25 | 9.96 | 8.65 |
| ROA (%) | 6.71 | 5.61 | 3.20 | 3.46 | 3.53 |
| ROE (%) | 23.08 | 17.95 | 12.24 | 13.32 | 14.82 |
Subsidiaries and associate of the Group
Given below is a brief overview of the operations of the subsidiaries and the associate of the Bank.
Local subsidiaries
Commercial Development Company PLC (CDC)
Established in 1980 as the Bank’s inaugural subsidiary, CDC owns the Head Office building of Commercial Bank, known as “Commercial House,” along with two additional properties in Negombo and Tangalle. The Bank owns a 90% stake in CDC.
CDC stands as the sole listed subsidiary of the Group, boasting a market capitalisation of Rs. 1.341 Bn. as of the end of 2023 (2022: Rs. 1.146 Bn.). Its primary operations involve renting premises, hiring of vehicles, outsourcing non-core staff and offering various utility services to the Bank.
In 2023, CDC reported a post-tax profit of Rs. 294.060 Mn., recording an increase of 31.06% from Rs. 224.378 Mn. in 2022. The rise in profits was primarily attributed to increased fair value gains recognised on investment properties. Income from core business activities rose by 8.93% to Rs. 687.510 Mn. (2022: Rs. 631.128 Mn.), while the cost of sales increased by 29.62% to Rs. 420.758 Mn. (2022: Rs. 324.607 Mn.), mainly due to rising operating costs across various business lines. Consequently, the gross profit decreased by 12.97% to Rs. 266.753 Mn. (2022: Rs. 306.521 Mn.). However, the net finance income surged by 91.43% to Rs. 124.343 Mn. in 2023 compared to Rs. 64.956 Mn. in 2022. This led to a 15.12% increase in profit before tax to Rs. 461.971 Mn. in 2023 from Rs. 401.289 Mn. in 2022. The total assets of the Company stood at Rs. 4.326 Bn. as of the end of 2023, compared to Rs. 4.055 Bn. as of the end of 2022.
CBC Tech Solutions Limited
CBC Tech Solutions Limited, a wholly owned subsidiary of the Bank, specialises in providing Information Technology services and solutions to the Bank, its subsidiaries and to a few selected corporates. Its primary lines of business include offering IT support, supplying hardware and licensed software, providing network solutions, hardware and Point of Sale (POS) maintenance, software development and outsourcing professional and skilled manpower to the Bank and its subsidiaries.
Currently, the Company operates from five regional support centers located in Colombo, Galle, Kandy, Jaffna and Badulla, aimed at providing prompt and efficient services.
In 2023, the Company maintained its island-wide personal computer/server maintenance, troubleshooted POS machines and provided IT first-level technical support for the Bank. Additionally, it introduced Network Solutions as a new business line to enhance profitability. The software development unit completed numerous projects, devised customer-centric products and white-labeled two products to expand market penetration. Furthermore, the Company focused on upskilling its employees and outsourcing them to the Bank’s subsidiaries.
CBC Tech Solutions serves as an agent for Lenovo’s lineup of personal computers, tablets and accessories, featuring popular series such as IdeaPad, Yoga, Legion and ThinkPad. Notably, the Company was the pioneer in importing Lenovo Think Centre Neo desktop computers equipped with 12th generation Intel® Core™ processors. In recognition of its achievements, CBC Tech Solutions was honoured with the Best Reseller Award by Lenovo’s Sri Lankan distributor, IT Gallery Computers (Pvt) Limited, in 2023.

In 2023, CBC Tech Solutions achieved a notable revenue of Rs. 812.547 Mn., marking a significant growth of 25.50% from Rs. 647.408 Mn. in 2022, largely attributed to increased income from licensed software sales. The Company’s pre-tax profit also saw a substantial rise, reaching Rs. 228.546 Mn. compared to Rs. 186.761 Mn. in 2022, representing a growth of 22.37%. Despite a marginal increase in post-tax profit to Rs. 173.573 Mn. from Rs. 171.724 Mn. in 2022, primarily due to a rise in income tax rate to 30% for the year, (principal income sources being exempt from income tax in 2022), CBC Tech Solutions remains committed to becoming a leading provider of innovative ICT solutions in Sri Lanka, prioritising customer-centric products and services to drive technological advancements.
CBC Finance Limited (CBCF)
CBCF operates as a wholly-owned subsidiary of the Bank and functions as a Licensed Finance Company (LFC) under the Finance Business Act No. 42 of 2011. Formerly known as Serendib Finance Ltd, CBCF underwent a rebranding initiative to become CBC Finance Ltd, subsequently launching an assertive image-enhancing campaign. Additionally, the Company bolstered its governance framework and established synergies with its parent company, Commercial Bank of Ceylon PLC.
Despite challenging industry conditions affecting customers of all sizes, CBCF managed to increase its gross income for 2023 to Rs. 1.991 Bn., marking a 21.72% rise from Rs. 1.636 Bn. in 2022. However, the Company faced significant pressure on its cost of funds, resulting in a decrease in net interest income by 7.62% to Rs. 496.478 Mn. in 2023 from Rs. 537.406 Mn. in 2022. On a positive note, net fee and commission income surged by 184.55% to Rs. 117.393 Mn. from Rs. 41.256 Mn. in 2022, contributing to a total operating income of Rs. 688.283 Mn. for 2023 compared to Rs. 639.900 Mn. in 2022. Despite this, impairment charges and other losses soared to Rs. 481.616 Mn., up by 93.29% from Rs. 249.162 Mn. in 2022, due to prudent provisions made for high-risk segments of the portfolio. As a result, the Company’s net operating income decreased from Rs. 390.739 Mn. in 2022 to Rs. 206.667 Mn. in 2023. Total operating expenses also rose to Rs. 527.272 Mn. in 2023 from Rs. 351.847 Mn. in 2022, representing a 49.86% increase. Consequently, CBCF reported a net loss of Rs. 225.178 Mn. for the year, in contrast to the net profit of Rs. 39.583 Mn. reported in 2022.
The aggressive pursuit of deposits persisted amidst intense competition, resulting in the year-end portfolio reaching Rs. 6.534 Bn., up from Rs. 5.116 Bn. reported at the end of 2022.
Despite facing the challenge of expanding portfolios in an unprecedented market environment, the Company’s total assets rose to Rs. 12.457 Bn. from Rs. 10.954 Bn. at the end of 2022. Additionally, its net loans and advances portfolio grew to Rs. 10.142 Bn. by the end of 2023, compared to Rs. 8.505 Bn. at the end of 2022.
The Company enhanced its delivery channels by establishing branches in Jaffna and Kalutara, with plans to open an additional five branches in 2024 in key business areas to strengthen its presence. Moreover, it intends to relocate its Kiribathgoda, Dambulla and Negombo branches in 2024 to improve the customer experience.
Commercial Insurance Brokers (Pvt) Ltd (CIBL)
The Bank holds a 60% stake in CIBL, which primarily engages in insurance brokering for various insurance types through reputable life and general insurance companies in Sri Lanka.
In the year ended December 31, 2023, CIBL reported a post-tax profit of Rs. 43.603 Mn., marking a significant growth of 39.09% compared to Rs. 31.349 Mn. in 2022. Additionally, CIBL’s total assets increased to Rs. 815.257 Mn. as of December 31, 2023, compared to Rs. 758.701 Mn. in the previous year.
Local associate
Equity Investments Lanka Ltd. (EQUILL)
The Bank holds a 22.92% stake in EQUILL, a venture capital company operating for 33 years. EQUILL primarily invests in equity and equity-featured debt instruments. In 2023, EQUILL reported a net profit of Rs. 15.248 Mn., a notable improvement compared to the net loss of Rs. 6.695 Mn. reported in 2022.
Foreign subsidiaries
Commercial Bank of Maldives Private Limited (CBM)
In collaboration with Tree Top Investments (TTI), CBM was established in the Republic of Maldives as the Bank’s second foreign subsidiary. TTI brings essential local market expertise to the partnership, holding a 45% stake, while the Bank holds the majority stake of 55% in CBM. Founded in the latter part of 2016, CBM inaugurated its Head Office and first branch in the capital city, Malé. By the end of 2017, CBM expanded with its second branch in Hulhumale, totaling two branches and managed two Offsite Automated Teller Machines by the close of 2023.
As CBM continues to offer a wide range of financial services, its aim is to emerge as the premier financial institution in the Republic of Maldives, distinguished by its advanced technology, innovation and customer-centric approach. In its third year of operation, CBM received recognition for ‘Excellence in Finance’ in the Banking and Finance category at the 2019 Maldives Business Awards. Furthermore, CBM solidified its position by being ranked among the top 100 companies in the Maldives at the “Gold 100 Gala” events in both 2021 and 2023, organised by Corporate Maldives. In 2022, CBM was honoured with the Global Business Outlook Banking Award 2021 in the “Fastest Growing Commercial Bank - Maldives 2021” category.
In line with CBM’s dedication to community engagement and social responsibility, CBM proudly sponsored the Children’s Day celebration in partnership with Rehendi School. The event, held in June 2023, aimed to commemorate Children’s Day with a special focus on Rehendi School students and other children in the community. As part of its contribution, CBM provided essential stationary items as gifts, distributed among all participating children. This initiative not only supported the Children’s Day celebration but also highlighted CBM’s commitment to the overall development of youth in the community.
CBM remained dedicated to its corporate social responsibility efforts through a valuable partnership with Care Society Maldives, which prioritises financial literacy and supports individuals with unique needs. In collaboration with Care Society, known for their work with children with disabilities, CBM organised a financial literacy session for 15 participants. The session focused on age-appropriate financial education, covering topics such as responsible spending, managing money physically and online and recognising scams.
CBM envisions itself “to be the trusted financial service provider for growth, committed to delivering excellence in service quality”. Renowned for its technological advancement, innovation and customer-centric approach, CBM aims to be the premier choice for financial services in the Republic of Maldives.
In 2023, CBM achieved significant growth in its deposits and advances, with a 9.52% increase in deposits reaching MVR 2.785 Bn. (2022: MVR 2.542 Bn.) and a 22.23% increase in net loans and advances reaching MVR 0.949 Bn. (2022: MVR 0.776 Bn.). Total assets also saw remarkable growth, up by 10.98% to MVR 3.248 Bn. (2022: 2.927 Bn.) by the end of 2023. CBM reported a post-tax profit of MVR 78.264 Mn. in 2023, marking a 36.15% increase from the previous year and the highest profit recorded in its 7-year operation period.
CBC Myanmar Microfinance Company (CBC Myanmar)
CBC Myanmar, a fully owned subsidiary of the Bank, commenced operations in July 2018 with the opening of its Head Office and a branch in Lewe Township, Nay Pyi Taw. Initially focused on the Microfinance sector, the Company expanded its operations to Aye Lar, Zabuthiri and Pyinmana townships after securing a permanent business license in 2021. As business conditions improved, CBC Myanmar further expanded its presence to Tatkon township in the last quarter of 2023.
The Myanmar economy was forecasted to grow by 3% in 2023, rebounding from an 18% contraction in 2021 and following a growth of 3% in 2022.
At the beginning of the year, CBC Myanmar had 27.7% of its portfolio classified as Portfolio at Risk (PAR). Through consistent recovery efforts over the course of the year, the Company managed to reduce its PAR to 12.9% by the end of the year, compared to the industry PAR, which remained above 25%.
In November 2022, CBC Myanmar secured a credit facility of MMK 1.5 Bn. through United Amara Bank (UAB) of Myanmar, backed by a Standby Letter of Credit facility of USD 1 Mn. issued by the parent company. This arrangement enabled CBC Myanmar to maintain credit growth, as further capital infusion was not feasible at the time. Subsequently, the Company successfully negotiated a similar facility with UAB, with the loan proceeds earmarked for expanding its loan book.
During 2023, the Company disbursed MMK 7.1 Bn. in new loans, a significant increase from MMK 3.7 Bn. in 2022. This led to a growth in interest income from MMK 463.93 Mn. to MMK 905.53 Mn., representing a remarkable 95.18% increase compared to the previous year. Despite this positive development, the Company reported a loss of MMK 154.38 Mn. for the financial year ended December 31, 2023, an improvement from the loss of MMK 806.11 Mn. recorded in 2022, mainly due to an increase in operating expenses in 2023.
Overall, the Company achieved a substantial increase in interest income driven by improvements in portfolio quality and loan book growth. However, the Company’s break-even target was further delayed due to sharp currency depreciation, as a significant portion of its expenses are denominated in USD.
The Company remains optimistic that current conditions will gradually improve, potentially allowing it to enter the profit zone early in 2024. Additionally, the Company has plans to expand into another region with more branches to maintain its growth momentum.
Commex Sri Lanka S.R.L. (Commex)
Commex, a fully-owned subsidiary of the Bank, commenced its operations under the Authorised Payments Institute (API) license issued by the Bank of Italy in 2016. However, due to the economic impact of COVID-19, the Board of Directors of Commex decided to voluntarily liquidate the Company in 2022. The Bank made an announcement regarding this decision to the Colombo Stock Exchange. The process of voluntary liquidation is underway and nearing completion.
Detailed information about the Group’s companies and a summary of key financial information for each company is given in the section on “Group Structure” on pages 142 and 143.
Summary of Interim Financial Statements Income Statement – Group and Bank – 2023 and 2022
| 1st Quarter ended March 31 |
2nd Quarter ended June 30 |
3rd Quarter ended September 30 |
4th Quarter ended December 31 |
For the Year ended December 31 |
|||||||||
| 2023 Rs. ’000 |
2022 Rs. ’000 |
2023 Rs. ’000 |
2022 Rs. ’000 |
2023 Rs. ’000 |
2022 Rs. ’000 |
2023 Rs. ’000 |
2022 Rs. ’000 |
2023 Rs. ’000 |
2022 Rs. ’000 |
||||
| Group | Group | ||||||||||||
| Net interest income | 18,975,227 | 18,823,025 | 18,474,443 | 21,889,560 | 23,432,092 | 22,101,235 | 25,533,597 | 21,851,391 | 86,415,359 | 84,665,211 | Net interest income | ||
| Net fee and commission income | 5,402,176 | 4,087,687 | 5,188,782 | 4,789,815 | 5,618,955 | 5,035,555 | 6,177,406 | 6,256,044 | 22,387,319 | 20,169,101 | Net fee and commission income | ||
| Other operating income (net) | 909,546 | 11,333,380 | 1,569,631 | 8,308,652 | 6,879,193 | 7,468,511 | 3,908,752 | 4,691,792 | 13,267,122 | 31,802,335 | Other operating income (net) | ||
| Less: Impairment and Other Losses | 6,797,175 | 5,960,556 | 6,413,788 | 29,258,063 | 12,571,147 | 17,052,988 | 13,112,960 | 19,652,653 | 38,895,070 | 71,924,260 | Less: Impairment and Other Losses | ||
| Net operating income | 18,489,774 | 28,283,536 | 18,819,068 | 5,729,964 | 23,359,093 | 17,552,313 | 22,506,795 | 13,146,574 | 83,174,730 | 64,712,387 | Net operating income | ||
| Less: Expenses | 11,749,584 | 11,875,805 | 11,469,178 | 8,758,423 | 12,422,111 | 8,893,074 | 13,610,351 | 10,676,320 | 49,251,224 | 40,203,622 | Less: Expenses | ||
| Operating profit | 6,740,190 | 16,407,731 | 7,349,890 | (3,028,459) | 10,936,982 | 8,659,239 | 8,896,444 | 2,470,254 | 33,923,506 | 24,508,765 | Operating profit | ||
| Add/(less): Share of profit/(loss) of associate, net of tax | 1,245 | (1,869) | 1,107 | (1,607) | 1,546 | 1,220 | (403) | (1,471) | 3,495 | (3,727) | Add/(less): Share of profit/(loss) of associate, net of tax | ||
| Profit before income tax | 6,741,435 | 16,405,862 | 7,350,997 | (3,030,066) | 10,938,528 | 8,660,459 | 8,896,041 | 2,468,783 | 33,927,001 | 24,505,038 | Profit before income tax | ||
| Less: Income tax expense | 2,382,405 | 4,631,158 | 3,419,553 | (433,112) | 4,465,397 | 2,377,804 | 1,759,986 | (6,470,284) | 12,027,341 | 105,566 | Less: Income tax expense | ||
| Profit for the period | 4,359,030 | 11,774,704 | 3,931,444 | (2,596,954) | 6,473,131 | 6,282,655 | 7,136,055 | 8,939,067 | 21,899,660 | 24,399,472 | Profit for the period | ||
| Quarterly profit as a percentage of the profit after tax of the year | 19.9 | 48.3 | 18.0 | (10.6) | 29.6 | 25.7 | 32.6 | 36.6 | 100.0 | 100.0 | Quarterly profit as a percentage of the profit after tax of the year | ||
| Cumulative quarterly profit as a percentage of the profit after tax of the year | 19.9 | 48.3 | 37.9 | 37.6 | 67.4 | 63.4 | 100.0 | 100.0 | – | – | Cumulative quarterly profit as a percentage of the profit after tax of the year |
||
| 1st Quarter ended March 31 |
2nd Quarter ended June 30 |
3rd Quarter ended September 30 |
4th Quarter ended December 31 |
For the Year ended December 31 |
|||||||||
| 2023 Rs. ’000 |
2022 Rs. ’000 |
2023 Rs. ’000 |
2022 Rs. ’000 |
2023 Rs. ’000 |
2022 Rs. ’000 |
2023 Rs. ’000 |
2022 Rs. ’000 |
2023 Rs. ’000 |
2022 Rs. ’000 |
||||
| Bank | Bank | ||||||||||||
| Net interest income | 18,208,012 | 18,294,991 | 17,718,922 | 21,131,976 | 22,545,916 | 21,283,570 | 24,630,715 | 21,033,493 | 83,103,565 | 81,744,030 | Net interest income | ||
| Net fee and commission income | 5,205,619 | 3,962,233 | 5,020,730 | 4,618,230 | 5,471,251 | 4,882,230 | 5,860,594 | 6,028,575 | 21,558,194 | 19,491,268 | Net fee and commission income | ||
| Other operating income (net) | 949,028 | 11,355,289 | 1,539,808 | 8,308,491 | 6,860,424 | 7,484,902 | 4,098,472 | 4,504,448 | 13,447,732 | 31,653,130 | Other operating income (net) | ||
| Less: Impairment charges and other losses | 6,640,021 | 5,869,091 | 6,462,414 | 29,091,260 | 12,816,947 | 16,951,155 | 12,704,357 | 19,550,116 | 38,623,739 | 71,461,622 | Less: Impairment charges and other losses | ||
| Net operating income | 17,722,638 | 27,743,422 | 17,817,046 | 4,967,437 | 22,060,644 | 16,699,547 | 21,885,424 | 12,016,400 | 79,485,752 | 61,426,806 | Net operating income | ||
| Less: Expenses | 11,385,750 | 11,654,722 | 11,182,815 | 8,480,267 | 12,122,385 | 8,626,581 | 12,914,642 | 10,066,851 | 47,605,592 | 38,828,421 | Less: Expenses | ||
| Profit before income tax | 6,336,888 | 16,088,700 | 6,634,231 | (3,512,830) | 9,938,259 | 8,072,966 | 8,970,782 | 1,949,549 | 31,880,160 | 22,598,385 | Profit before income tax | ||
| Less: Income tax expense | 2,245,815 | 4,541,083 | 3,211,792 | (557,428) | 4,148,494 | 2,226,823 | 1,813,097 | (6,581,884) | 11,419,198 | (371,406) | Less: Income tax expense | ||
| Profit for the period | 4,091,073 | 11,547,617 | 3,422,439 | (2,955,402) | 5,789,765 | 5,846,143 | 7,157,685 | 8,531,433 | 20,460,962 | 22,969,791 | Profit for the period | ||
| Quarterly profit as a percentage of the profit after tax of the year | 20.0 | 50.3 | 16.7 | (12.9) | 28.3 | 25.5 | 35.0 | 37.1 | 100.0 | 100.0 | Quarterly profit as a percentage of the profit after tax of the year | ||
| Cumulative quarterly profit as a percentage of the profit after tax of the year | 20.0 | 50.3 | 36.7 | 37.4 | 65.0 | 62.9 | 100.0 | 100.0 | – | – | Cumulative quarterly profit as a percentage of the profit after tax of the year |
||
Statement of Financial Position – Group – 2023 and 2022
| 1st Quarter | 2nd Quarter | 3rd Quarter | 4th Quarter | |||||||
| As at | March 31, 2023 Rs. ’000 |
March 31, 2022 Rs. ’000 |
June 30, 2023 (Audited) Rs. ’000 |
June 30, 2022 (Audited) Rs. ’000 |
September 30, 2023 Rs. ’000 |
September 30, 2022 Rs. ’000 |
December 31, 2023 (Audited) Rs. ’000 |
December 31, 2022 (Audited) Rs. ’000 |
As at | |
| Assets | Assets | |||||||||
| Cash and cash equivalents | 147,860,571 | 139,725,913 | 112,544,293 | 107,999,772 | 114,518,140 | 117,183,269 | 159,701,507 | 151,109,490 | Cash and cash equivalents | |
| Balances with Central Banks | 95,653,467 | 87,849,345 | 61,871,953 | 51,501,124 | 37,516,912 | 60,156,210 | 62,633,503 | 78,597,120 | Balances with Central Banks | |
| Placements with banks | 54,909,247 | 5,882,556 | 53,920,816 | 18,313,838 | 66,538,167 | 57,528,580 | 81,506,653 | 96,082,937 | Placements with banks | |
| Securities purchased under re-sale agreements | 3,524,478 | 1,756,293 | 3,378,561 | 2,002,143 | 549,770 | – | 31,148,729 | 1,517,308 | Securities purchased under re-sale agreements | |
| Derivative financial assets | 8,064,310 | 24,426,913 | 7,032,972 | 23,674,635 | 6,091,290 | 8,336,323 | 7,226,484 | 8,345,091 | Derivative financial assets | |
| Financial assets recognised through profit or loss – measured at fair value | 28,922,409 | 25,090,307 | 50,791,983 | 54,201,704 | 98,042,540 | 42,638,708 | 29,449,653 | 24,873,057 | Financial assets recognised through profit or loss/Held for trading – measured at fair value | |
| Financial assets at amortised cost – Loans and advances to banks | – | – | – | – | – | – | – | – | Financial assets at amortised cost – Loans and advances to banks | |
| Financial assets at amortised cost – Loans and advances to other customers | 1,094,383,487 | 1,158,500,812 | 1,096,826,774 | 1,219,947,845 | 1,148,276,787 | 1,159,104,807 | 1,204,865,597 | 1,155,492,527 | Financial assets at amortised cost – Loans and advances to other customers | |
| Financial assets at amortised cost – Debt and other financial instruments | 765,050,417 | 451,890,370 | 740,197,253 | 770,170,847 | 706,747,778 | 744,530,469 | 685,155,537 | 761,650,234 | Financial assets at amortised cost – Debt and other financial instruments | |
| Financial assets measured at fair value through other comprehensive income | 186,912,374 | 316,414,558 | 230,826,265 | 71,383,043 | 246,477,855 | 108,526,607 | 287,732,972 | 118,652,257 | Financial assets measured at fair value through other comprehensive income | |
| Investments in subsidiaries | – | – | – | – | – | – | – | – | Investments in subsidiaries | |
| Investments in associate | 56,778 | 57,656 | 57,856 | 55,628 | 59,475 | 57,053 | 59,004 | 55,302 | Investments in associates | |
| Property, plant and equipment and right-of-use assets | 27,492,933 | 25,535,145 | 26,649,043 | 25,830,332 | 26,538,514 | 25,881,016 | 28,997,246 | 27,446,607 | Property, plant and equipment and right-of-use assets | |
| Investment properties | 326,350 | 72,400 | 424,550 | 72,400 | 545,850 | 72,400 | 597,825 | 80,350 | Investment properties | |
| Intangible assets | 4,137,176 | 2,505,708 | 4,042,878 | 2,653,532 | 4,061,409 | 3,303,890 | 4,289,404 | 4,113,200 | Intangible assets | |
| Leasehold property | – | – | – | – | – | – | – | – | Leasehold property | |
| Deferred tax assets | 30,366,788 | 16,467,507 | 30,251,431 | 15,604,218 | 32,664,942 | 18,688,275 | 34,511,410 | 30,727,213 | Deferred tax assets | |
| Other assets | 44,558,078 | 30,384,439 | 43,351,569 | 40,069,160 | 36,882,221 | 44,293,042 | 37,736,151 | 40,811,211 | Other assets | |
| Total assets | 2,492,218,863 | 2,286,559,922 | 2,462,168,197 | 2,403,480,221 | 2,525,511,650 | 2,390,300,649 | 2,655,611,675 | 2,499,553,904 | Total assets | |
| Liabilities | Liabilities | |||||||||
| Due to banks | 42,905,385 | 78,825,477 | 50,020,369 | 64,607,923 | 48,268,948 | 65,021,690 | 47,948,578 | 64,971,170 | Due to banks | |
| Derivative financial liabilities | 8,121,606 | 13,445,927 | 5,309,026 | 8,640,775 | 1,560,980 | 4,350,184 | 2,319,209 | 2,880,667 | Derivative financial liabilities | |
| Securities sold under repurchase agreements | 96,322,359 | 168,475,481 | 133,588,179 | 214,906,611 | 117,895,187 | 129,659,272 | 111,186,824 | 97,726,435 | Securities sold under repurchase agreements | |
| Financial liabilities at amortised cost – due to depositors | 2,023,418,699 | 1,706,467,472 | 1,958,690,813 | 1,756,807,475 | 2,038,498,641 | 1,853,469,051 | 2,147,906,858 | 1,977,743,661 | Financial liabilities at amortised cost – due to depositors | |
| Financial liabilities at amortised cost – other borrowings | 10,837,010 | 32,042,811 | 11,481,198 | 30,611,911 | 13,243,625 | 20,905,990 | 12,756,021 | 16,150,356 | Financial liabilities at amortised cost – other borrowings | |
| Current tax liabilities | 23,651,014 | 13,745,921 | 23,513,300 | 17,887,416 | 14,420,344 | 19,391,280 | 15,256,244 | 24,916,074 | Current tax liabilities | |
| Deferred tax liabilities | 435,020 | 348,851 | 433,316 | 348,867 | 431,708 | 349,849 | 514,207 | 437,123 | Deferred tax liabilities | |
| Other liabilities | 44,064,040 | 52,266,429 | 36,253,554 | 57,394,541 | 48,296,812 | 41,904,727 | 56,266,302 | 40,354,877 | Other liabilities | |
| Due to subsidiaries | – | – | – | – | – | – | – | – | Due to subsidiaries | |
| Subordinated liabilities | 33,487,710 | 45,117,068 | 33,262,957 | 50,868,395 | 24,869,883 | 50,935,604 | 36,482,939 | 61,400,967 | Subordinated liabilities | |
| Total liabilities | 2,283,242,843 | 2,110,735,437 | 2,252,552,712 | 2,202,073,914 | 2,307,486,128 | 2,185,987,647 | 2,430,637,182 | 2,286,581,330 | Total liabilities | |
| Equity | Equity | |||||||||
| Stated capital | 62,891,772 | 58,149,621 | 62,891,772 | 58,149,621 | 62,948,003 | 58,149,621 | 62,948,003 | 58,149,621 | Stated capital | |
| Statutory reserves | 12,079,670 | 10,590,338 | 12,079,670 | 10,590,338 | 12,079,670 | 10,590,338 | 13,586,534 | 12,079,670 | Statutory reserves | |
| Retained earnings | 5,440,390 | 12,625,944 | 9,216,216 | 4,689,644 | 15,470,462 | 10,795,707 | 9,943,003 | 6,790,304 | Retained earnings | |
| Other reserves | 124,736,413 | 91,496,084 | 121,617,007 | 124,232,206 | 123,309,743 | 120,834,984 | 133,993,167 | 131,845,571 | Other reserves | |
| Total equity attributable to equity holders of the Group | 205,148,245 | 172,861,987 | 205,804,665 | 197,661,809 | 213,807,878 | 200,370,650 | 220,470,707 | 208,865,166 | Total equity attributable to equity holders of the Group | |
| Non-controlling interest | 3,827,775 | 2,962,498 | 3,810,820 | 3,744,498 | 4,217,644 | 3,942,352 | 4,503,786 | 4,107,408 | Non-controlling interest | |
| Total equity | 208,976,020 | 175,824,485 | 209,615,485 | 201,406,307 | 218,025,522 | 204,313,002 | 224,974,493 | 212,972,574 | Total equity | |
| Total liabilities and equity | 2,492,218,863 | 2,286,559,922 | 2,462,168,197 | 2,403,480,221 | 2,525,511,650 | 2,390,300,649 | 2,655,611,675 | 2,499,553,904 | Total liabilities and equity | |
| Contingent liabilities and commitments | 629,373,712 | 859,963,467 | 605,333,607 | 723,286,189 | 602,365,134 | 600,709,801 | 675,776,516 | 555,531,537 | Contingent liabilities and commitments | |
| Net assets value per ordinary share (Rs.) | 156.18 | 139.43 | 156.68 | 159.43 | 162.70 | 161.62 | 167.77 | 168.47 | Net assets value per ordinary share (Rs.) | |
| Quarterly growth (%) | Quarterly growth (%) | |||||||||
| Financial assets at amortised cost – loans and advances to banks & loans and advances to other customers |
-5.29% | 12.52% | 0.22% | 5.30% | 4.69% | -4.99% | 4.93% | -0.31% | Financial assets at amortised cost – Loans and advances to banks & loans and advances to other customers |
|
| Financial liabilities at amortised cost – due to depositors | 2.31% | 15.88% | -3.20% | 2.95% | 4.07% | 5.50% | 5.37% | 6.70% | Financial liabilities at amortised cost – due to depositors | |
| Total assets | -0.29% | 15.28% | -1.21% | 5.11% | 2.57% | -0.55% | 5.15% | 4.57% | Total assets | |
Statement of Financial Position – Bank – 2023 and 2022
| 1st Quarter | 2nd Quarter | 3rd Quarter | 4th Quarter | |||||||
| As at | March 31, 2023 Rs. ’000 |
March 31, 2022 Rs. ’000 |
June 30, 2023 (Audited) Rs. ’000 |
June 30, 2022 (Audited) Rs. ’000 |
September 30, 2023 Rs. ’000 |
September 30, 2022 Rs. ’000 |
December 31, 2023 (Audited) Rs. ’000 |
December 31, 2022 (Audited) Rs. ’000 |
As at | |
| Assets | Assets | |||||||||
| Cash and cash equivalents | 146,685,596 | 138,554,687 | 110,088,365 | 106,644,408 | 111,976,719 | 115,987,885 | 157,819,287 | 149,393,611 | Cash and cash equivalents | |
| Balances with Central Banks | 84,945,804 | 81,086,848 | 53,719,053 | 45,197,919 | 27,819,813 | 50,225,992 | 52,817,502 | 66,493,499 | Balances with Central Banks | |
| Placements with banks | 54,689,175 | 4,580,100 | 53,711,794 | 17,327,567 | 66,337,893 | 56,536,485 | 81,344,696 | 95,899,645 | Placements with banks | |
| Securities purchased under re-sale agreements | 3,524,478 | 1,756,293 | 3,378,561 | 2,002,143 | 549,770 | – | 31,148,729 | 1,517,308 | Securities purchased under re-sale agreements | |
| Derivative financial assets | 8,064,310 | 24,426,913 | 7,032,972 | 23,674,635 | 6,091,290 | 8,336,323 | 7,226,484 | 8,345,091 | Derivative financial assets | |
| Financial assets recognised through profit or loss – measured at fair value | 28,922,409 | 25,090,307 | 50,791,983 | 54,201,704 | 98,042,540 | 42,638,708 | 29,449,653 | 24,873,057 | Financial assets recognised through profit or loss – measured at fair value | |
| Financial assets at amortised cost – Loans and advances to banks | – | – | – | – | – | – | – | – | Financial assets at amortised cost – Loans and advances to banks | |
| Financial assets at amortised cost – Loans and advances to other customers | 1,070,780,771 | 1,139,304,710 | 1,071,346,946 | 1,197,683,170 | 1,119,577,738 | 1,136,121,535 | 1,176,359,971 | 1,130,442,579 | Financial assets at amortised cost – Loans and advances to other customers | |
| Financial assets at amortised cost – Debt and other financial instruments | 724,191,295 | 424,805,507 | 705,929,076 | 730,882,224 | 672,664,794 | 708,272,738 | 649,740,408 | 725,935,299 | Financial assets at amortised cost – Debt and other financial instruments | |
| Financial assets measured at fair value through other comprehensive income | 186,131,686 | 315,781,767 | 230,097,911 | 69,648,186 | 245,702,748 | 106,976,948 | 287,023,009 | 117,056,240 | Financial assets measured at fair value through other comprehensive income | |
| Investments in subsidiaries | 5,808,429 | 5,808,429 | 5,808,429 | 5,808,429 | 5,808,429 | 5,808,429 | 5,808,429 | 5,808,429 | Investments in subsidiaries | |
| Investments in associate | 44,331 | 44,331 | 44,331 | 44,331 | 44,331 | 44,331 | 44,331 | 44,331 | Investments in associate | |
| Property, plant and equipment and right-of-use assets | 25,502,884 | 23,719,230 | 24,608,919 | 23,872,579 | 24,415,513 | 23,852,100 | 26,257,902 | 25,425,452 | Property, plant and equipment and right-of-use assets | |
| Investment properties | – | – | – | – | – | – | – | – | Investment properties | |
| Intangible assets | 3,588,752 | 1,941,213 | 3,500,095 | 2,084,157 | 3,516,989 | 2,745,081 | 3,736,504 | 3,563,120 | Intangible assets | |
| Leasehold property | – | – | – | – | – | – | – | – | Leasehold property | |
| Deferred tax assets | 29,941,540 | 16,169,713 | 29,844,651 | 15,274,931 | 32,347,028 | 18,355,515 | 34,076,526 | 30,301,203 | Deferred tax assets | |
| Other assets | 44,325,133 | 30,285,171 | 43,100,720 | 39,964,157 | 36,579,912 | 44,160,287 | 37,474,448 | 40,699,168 | Other assets | |
| Total assets | 2,417,146,593 | 2,233,355,219 | 2,393,003,806 | 2,334,310,540 | 2,451,475,507 | 2,320,062,357 | 2,580,327,879 | 2,425,798,032 | Total assets | |
| Liabilities | Liabilities | |||||||||
| Due to banks | 43,057,367 | 78,898,400 | 49,463,863 | 64,643,031 | 47,554,766 | 65,126,753 | 47,274,361 | 65,130,061 | Due to banks | |
| Derivative financial liabilities | 8,121,606 | 13,445,927 | 5,309,026 | 8,640,775 | 1,560,980 | 4,350,184 | 2,319,209 | 2,880,667 | Derivative financial liabilities | |
| Securities sold under repurchase agreements | 96,467,167 | 168,582,810 | 133,599,880 | 215,162,077 | 117,912,371 | 129,837,305 | 111,198,516 | 97,726,435 | Securities sold under repurchase agreements | |
| Financial liabilities at amortised cost – due to depositors | 1,957,874,217 | 1,660,680,484 | 1,900,074,880 | 1,696,848,972 | 1,976,214,831 | 1,792,802,024 | 2,085,046,149 | 1,914,359,494 | Financial liabilities at amortised cost – due to depositors | |
| Financial liabilities at amortised cost – other borrowings | 10,837,010 | 32,042,811 | 11,481,198 | 30,611,911 | 13,243,625 | 20,905,990 | 12,756,021 | 16,150,356 | Financial liabilities at amortised cost – other borrowings | |
| Current tax liabilities | 23,261,394 | 13,482,706 | 22,992,243 | 17,505,583 | 14,133,449 | 19,124,762 | 14,951,984 | 24,475,319 | Current tax liabilities | |
| Deferred tax liabilities | – | – | – | – | – | – | – | – | Deferred tax liabilities | |
| Other liabilities | 43,563,528 | 52,002,171 | 35,754,190 | 57,008,590 | 47,596,692 | 41,461,508 | 55,050,477 | 39,860,573 | Other liabilities | |
| Due to subsidiaries | 79,101 | 86,493 | 76,893 | 115,191 | 61,483 | 96,295 | 317,221 | 115,484 | Due to subsidiaries | |
| Subordinated liabilities | 33,487,710 | 45,117,068 | 33,262,957 | 50,868,395 | 24,869,883 | 50,935,604 | 36,482,939 | 61,400,967 | Subordinated liabilities | |
| Total liabilities | 2,216,749,100 | 2,064,338,870 | 2,192,015,130 | 2,141,404,525 | 2,243,148,080 | 2,124,640,425 | 2,365,396,877 | 2,222,099,356 | Total liabilities | |
| Equity | Equity | |||||||||
| Stated capital | 62,891,772 | 58,149,621 | 62,891,772 | 58,149,621 | 62,948,003 | 58,149,621 | 62,948,003 | 58,149,621 | Stated capital | |
| Statutory reserves | 11,352,858 | 10,204,368 | 11,352,858 | 10,204,368 | 11,352,858 | 10,204,368 | 12,375,906 | 11,352,858 | Statutory reserves | |
| Retained earnings | 4,116,877 | 11,626,483 | 7,565,019 | 3,647,706 | 13,375,628 | 9,504,182 | 8,558,385 | 5,592,121 | Retained earnings | |
| Other reserves | 122,035,986 | 89,035,877 | 119,179,027 | 120,904,320 | 120,650,938 | 117,563,761 | 131,048,708 | 128,604,076 | Other reserves | |
| Total equity attributable to equity holders of the Bank | 200,397,493 | 169,016,349 | 200,988,676 | 192,906,015 | 208,327,427 | 195,421,932 | 214,931,002 | 203,698,676 | Total equity attributable to equity holders of the Bank | |
| Non-controlling interest | – | – | – | – | – | – | – | – | Non-controlling interest | |
| Total equity | 200,397,493 | 169,016,349 | 200,988,676 | 192,906,015 | 208,327,427 | 195,421,932 | 214,931,002 | 203,698,676 | Total equity | |
| Total liabilities and equity | 2,417,146,593 | 2,233,355,219 | 2,393,003,806 | 2,334,310,540 | 2,451,475,507 | 2,320,062,357 | 2,580,327,879 | 2,425,798,032 | Total liabilities and equity | |
| Contingent liabilities and commitments | 626,574,663 | 857,057,146 | 602,121,702 | 719,729,198 | 600,102,554 | 596,546,623 | 668,875,778 | 549,421,699 | Contingent liabilities and commitments | |
| Net assets value per ordinary share (Rs.) | 152.57 | 136.33 | 153.02 | 155.60 | 158.53 | 157.63 | 163.55 | 164.30 | Net assets value per ordinary share (Rs.) | |
| Quarterly growth (%) | Quarterly growth (%) | |||||||||
| Financial assets at amortised cost – loans and advances to banks & Loans and advances to other customers |
-5.28% | 12.29% | 0.05% | 5.12% | 4.50% | -5.14% | 5.07% | -0.50% | Financial assets at amortised cost – Loans and advances to banks & Loans and advances to other customers |
|
| Financial liabilities at amortised cost – due to depositors | -2.27% | 15.08% | -2.95% | 2.18% | 4.01% | 5.65% | 5.51% | 6.78% | Financial liabilities at amortised cost – due to depositors | |
| Total assets | -0.36% | 14.58% | -1.00% | 4.52% | 2.44% | -0.61% | 5.26% | 4.56% | Total assets | |
Decade at a glance
| Bank | SLFRSs | SLFRSs | LKASs | ||||||||||
| As at December 31, Rs. Mn. |
CAGR* (%) |
2023 | 2022 | 2021 | 2020 | 2019 | 2018 | 2017 | 2016 | 2015 | 2014 | ||
| Assets | |||||||||||||
| Cash and cash equivalents | 157,819 | 149,394 | 68,078 | 50,251 | 52,535 | 39,534 | 33,225 | 30,194 | 20,044 | 20,592 | |||
| Balances with Central Banks | 52,818 | 66,493 | 52,898 | 110,971 | 39,461 | 54,385 | 44,801 | 43,873 | 28,221 | 19,634 | |||
| Placements with banks | 81,345 | 95,900 | 11,585 | 15,939 | 24,527 | 19,899 | 17,633 | 11,718 | 17,194 | 14,508 | |||
| Securities purchased under resale agreements | 31,149 | 1,517 | 3,000 | – | 13,148 | 9,514 | – | – | 8,002 | 41,198 | |||
| Derivative financial assets | 7,226 | 8,345 | 3,245 | 2,637 | 1,831 | 7,910 | 2,335 | 1,053 | 4,118 | 460 | |||
| Other financial instruments – Held for trading | – | – | – | – | – | – | 4,411 | 4,988 | 7,656 | 6,327 | |||
| Financial assets recognised through profit or loss – Measured at fair value | 29,450 | 24,873 | 23,436 | 35,189 | 21,468 | 5,520 | – | – | – | – | |||
| Loans and receivables to banks | 12.77 |  |
– | – | – | – | – | – | 641 | 624 | 601 | 551 | |
| Financial assets at amortised cost – Loans and advances to banks | – | – | – | 780 | 758 | 763 | – | – | – | – | |||
| Loans and receivables to other customers | – | – | – | – | – | – | 737,447 | 616,018 | 508,115 | 405,431 | |||
| Financial assets at amortised cost – Loans and advances to other customers | 1,176,360 | 1,130,443 | 1,014,619 | 896,845 | 884,646 | 861,100 | – | – | – | – | |||
| Financial investments – Held to maturity | – | – | – | – | – | – | 63,563 | 60,981 | – | – | |||
| Financial investments – Loans and receivables | – | – | – | – | – | – | 48,712 | 51,824 | 57,724 | 50,436 | |||
| Financial assets at amortised cost – Debt and other financial instruments | 649,740 | 725,935 | 369,418 | 292,728 | 101,145 | 83,855 | – | – | – | – | |||
| Financial investments – Available for sale | – | – | – | – | – | – | 154,714 | 160,023 | 204,244 | 214,208 | |||
| Financial assets measured at fair value through other comprehensive income | 287,023 | 117,056 | 335,463 | 278,461 | 197,568 | 176,507 | – | – | – | – | |||
| Total financial assets | 2,472,930 | 2,319,956 | 1,881,742 | 1,683,801 | 1,337,087 | 1,258,987 | 1,107,482 | 981,296 | 855,919 | 773,345 | |||
| Investments in subsidiaries | 5,808 | 5,808 | 5,808 | 5,808 | 5,011 | 4,264 | 3,066 | 2,435 | 1,237 | 1,211 | |||
| Investment in associate | 44 | 44 | 44 | 44 | 44 | 44 | 44 | 44 | 44 | 44 | |||
| Property, plant & equipment and right-of-use assets | 26,258 | 25,425 | 23,075 | 23,212 | 20,507 | 15,301 | 14,635 | 10,308 | 9,969 | 9,953 | |||
| Intangible assets | 3,737 | 3,563 | 1,725 | 1,233 | 1,080 | 906 | 777 | 641 | 466 | 439 | |||
| Leasehold property | – | – | – | – | – | 72 | 73 | 74 | 74 | 75 | |||
| Deferred tax assets | 34,077 | 30,301 | 9,793 | 2,500 | 294 | – | – | 964 | – | – | |||
| Other assets | 37,474 | 40,699 | 27,024 | 19,620 | 23,323 | 23,911 | 17,297 | 16,439 | 12,096 | 10,543 | |||
| Total assets | 15.59 | 2,580,328 | 2,425,798 | 1,949,213 | 1,736,218 | 1,387,346 | 1,303,485 | 1,143,374 | 1,012,201 | 879,805 | 795,610 | ||
| Liabilities | |||||||||||||
| Due to banks | 47,274 | 65,130 | 73,777 | 87,451 | 51,506 | 50,101 | 57,121 | 67,609 | 30,319 | 25,261 | |||
| Derivative financial liabilities | 2,319 | 2,881 | 2,092 | 1,501 | 1,495 | 8,022 | 3,678 | 1,515 | 1,891 | 1,193 | |||
| Securities sold under repurchase agreements | 111,199 | 97,726 | 151,912 | 91,438 | 51,220 | 49,104 | 49,677 | 69,867 | 112,385 | 124,564 | |||
| Due to other customers/deposits from customers | 16.54 |  |
– | – | – | – | – | – | 850,128 | 739,563 | 624,102 | 529,361 | |
| Financial liabilities at amortised cost – Due to depositors | 2,085,046 | 1,914,359 | 1,443,093 | 1,265,966 | 1,053,308 | 983,037 | – | – | – | – | |||
| Other borrowings | – | – | – | – | – | – | 23,786 | 9,270 | 9,986 | 11,637 | |||
| Financial liabilities at amortised cost – Other borrowings | 12,756 | 16,150 | 32,587 | 54,556 | 23,249 | 25,362 | – | – | – | – | |||
| Current tax liabilities | 14,952 | 24,475 | 9,294 | 6,778 | 4,968 | 6,566 | 4,144 | 3,441 | 3,002 | 1,998 | |||
| Deferred tax liabilities | – | – | – | – | – | 646 | 3,275 | – | 231 | 2,574 | |||
| Other provisions | – | – | – | – | – | – | – | 2 | 2 | 2 | |||
| Other liabilities | 55,050 | 39,861 | 33,211 | 33,038 | 30,497 | 24,208 | 19,225 | 17,710 | 15,547 | 17,444 | |||
| Due to subsidiaries | 317 | 115 | 49 | 97 | 54 | 41 | 75 | 20 | 26 | 19 | |||
| Subordinated liabilities | 36,483 | 61,401 | 38,303 | 38,247 | 37,887 | 37,992 | 25,166 | 24,850 | 11,973 | 11,045 | |||
| Total liabilities | 2,365,397 | 2,222,099 | 1,784,319 | 1,579,072 | 1,254,184 | 1,185,079 | 1,036,275 | 933,847 | 809,464 | 725,098 | |||
| Equity | |||||||||||||
| Stated capital | 62,948 | 58,150 | 54,567 | 52,188 | 40,917 | 39,148 | 37,144 | 24,978 | 23,255 | 21,458 | |||
| Statutory reserves | 12,376 | 11,353 | 10,204 | 9,024 | 8,205 | 7,354 | 6,477 | 5,648 | 4,922 | 4,327 | |||
| Retained earnings | 8,558 | 5,592 | 9,028 | 7,596 | 5,144 | 5,063 | 4,987 | 4,464 | 4,389 | 4,258 | |||
| Other reserves | 131,049 | 128,604 | 91,094 | 88,338 | 78,896 | 66,841 | 58,491 | 43,264 | 37,775 | 40,469 | |||
| Total liabilities and equity | 15.59 | 2,580,328 | 2,425,798 | 1,949,213 | 1,736,218 | 1,387,346 | 1,303,485 | 1,143,374 | 1,012,201 | 879,805 | 795,610 | ||
| Contingent liabilities and commitments | 668,876 | 549,422 | 682,400 | 728,712 | 579,999 | 658,722 | 564,795 | 498,305 | 521,232 | 352,453 | |||
(*) CAGR – Compound Annual Growth Rate
| Bank | SLFRSs | SLFRSs | LKASs | ||||||||||
| For the year ended December 31, Rs. Mn. |
CAGR* (%) |
2023 | 2022 | 2021 | 2020 | 2019 | 2018 | 2017 | 2016 | 2015 | 2014 | ||
| Operating results | |||||||||||||
| Gross income | 16.37 | 335,770 | 275,444 | 160,886 | 149,711 | 148,706 | 138,049 | 114,357 | 93,143 | 77,868 | 72,753 | ||
| Interest income | 292,618 | 218,327 | 130,443 | 122,330 | 127,780 | 117,466 | 103,034 | 80,738 | 66,030 | 61,832 | |||
| Interest expense | (209,515) | (136,583) | (65,832) | (72,759) | (80,571) | (72,524) | (64,011) | (47,915) | (35,685) | (34,610) | |||
| Foreign exchange profit | 4,908 | 31,120 | 10,589 | 8,338 | 6,726 | 7,900 | 588 | 2,326 | 2,877 | 1,481 | |||
| Net commission and other income | 30,098 | 20,024 | 16,195 | 17,031 | 12,082 | 10,845 | 9,169 | 8,951 | 8,059 | 8,677 | |||
| Operating expenses, impairment and taxes on financial services | (86,229) | (110,290) | (59,394) | (51,429) | (43,678) | (38,096) | (25,597) | (24,049) | (24,138) | (21,644) | |||
| Profit before tax | 8.19 | 31,880 | 22,598 | 32,001 | 23,511 | 22,339 | 25,591 | 23,183 | 20,051 | 17,143 | 15,736 | ||
| Income tax expense | (11,419) | 372 | (8,395) | (7,138) | (5,314) | (8,047) | (6,602) | (5,539) | (5,240) | (4,556) | |||
| Profit for the year | 6.96 | 20,461 | 22,970 | 23,606 | 16,373 | 17,025 | 17,544 | 16,581 | 14,512 | 11,903 | 11,180 | ||
| Ratios | |||||||||||||
| Return on average shareholders’ funds (%) | 9.78 | 12.46 | 14.66 | 11.28 | 13.54 | 15.56 | 17.88 | 19.52 | 16.90 | 17.01 | |||
| Income growth (%) | 21.90 | 71.20 | 7.46 | 0.68 | 7.72 | 20.72 | 24.10 | 19.62 | 7.03 | 0.96 | |||
| Return on average assets (%) | 0.82 | 1.05 | 1.28 | 1.05 | 1.27 | 1.43 | 1.54 | 1.53 | 1.42 | 1.60 | |||
| Ordinary share dividend cover (times) | 2.40 | 4.12 | 2.64 | 2.34 | 2.55 | 2.67 | 2.62 | 2.25 | 2.09 | 1.99 | |||
| Advances to deposits and refinance (%) | 60.33 | 63.30 | 73.54 | 72.96 | 86.74 | 86.96 | 86.07 | 82.69 | 80.84 | 75.89 | |||
| Property, plant & equipment and intangible assets to shareholders’ funds (%) | 13.96 | 14.23 | 15.04 | 15.56 | 16.21 | 13.75 | 14.46 | 14.07 | 14.94 | 14.85 | |||
| Total assets to shareholders’ funds (times) | 12.01 | 11.91 | 11.82 | 11.05 | 10.42 | 11.01 | 10.68 | 12.92 | 12.51 | 11.28 | |||
| Capital funds to liabilities including contingent liabilities (%) | 7.08 | 7.35 | 6.68 | 6.81 | 7.26 | 6.42 | 6.69 | 5.47 | 5.29 | 6.54 | |||
| Cost/income ratio (%) | 40.31 | 29.22 | 37.97 | 39.96 | 49.41 | 46.35 | 51.08 | 51.06 | 48.92 | 49.26 | |||
| Liquid assets ratio – Consolidated (Sri Lankan Operations) (%) | 46.06 | 35.88 | N/A | N/A | N/A | N/A | N/A | N/A | N/A | N/A | |||
| Liquid assets ratio – Domestic Banking Unit (DBU) (%) | N/A | 35.01 | 38.73 | 44.99 | 30.42 | 24.47 | 27.28 | 27.19 | 26.24 | 33.15 | |||
| Liquid assets ratio – Offshore Banking Centre (OBC) (%) | N/A | 32.37 | 36.39 | 32.70 | 25.25 | 30.20 | 30.95 | 30.19 | 49.13 | 31.43 | |||
| (As specified in the Banking Act No. 30 of 1988) | |||||||||||||
| Capital adequacy (%) (under Basel II ) Tier I | N/A | N/A | N/A | N/A | N/A | N/A | N/A | 11.56 | 11.60 | 12.93 | |||
| Tier I & II | N/A | N/A | N/A | N/A | N/A | N/A | N/A | 15.89 | 14.26 | 15.97 | |||
| Capital adequacy (%) (under Basel III) | |||||||||||||
| Common equity Tier I capital ratio | 11.44 | 11.39 | 11.92 | 13.22 | 12.30 | 11.34 | 12.11 | N/A | N/A | N/A | |||
| Tier I capital ratio | 11.44 | 11.39 | 11.92 | 13.22 | 12.30 | 11.34 | 12.11 | N/A | N/A | N/A | |||
| Total capital ratio | 15.15 | 14.66 | 15.65 | 16.82 | 16.15 | 15.60 | 15.75 | N/A | N/A | N/A | |||
| Share information | |||||||||||||
| Market value of a voting ordinary share (Rs.) | 95.50 | 50.20 | 79.30 | 80.90 | 95.00 | 115.00 | 135.80 | 145.00 | 140.20 | 171.00 | |||
| Earnings per share (Rs.) | 16 | 17 | 19 | 15 | 17 | 17 | 17 | 16 | 13 | 13 | |||
| Dividend per share (Rs.) | 6.50 | 4.50 | 7.50 | 6.50 | 6.50 | 6.50 | 6.50 | 6.50 | 6.50 | 6.50 | |||
| Price earnings ratio (times) | 6 | 3 | 4 | 5 | 5 | 7 | 8 | 9 | 10 | 13 | |||
| Net assets value per share (Rs.) | 164 | 164 | 138 | 135 | 130 | 117 | 108 | 88 | 80 | 81 | |||
| Earnings yield (%) | 16 | 35 | 24 | 19 | 17 | 15 | 13 | 11 | 10 | 8 | |||
| Gross dividends (Rs. Bn.) to ordinary shareholders | 8.54 | 5.58 | 8.96 | 7.59 | 6.68 | 6.57 | 6.48 | 5.77 | 5.70 | 5.70 | |||
| Dividend payout ratio (%) – Cash | 29 | – | 22 | 32 | 27 | 26 | 26 | 28 | 33 | 35 | |||
| Total dividend payout ratio (%) | 42 | 24 | 38 | 46 | 39 | 37 | 38 | 40 | 48 | 50 | |||
| Other information | |||||||||||||
| Number of employees | 5,201 | 5,121 | 5,072 | 5,057 | 5,062 | 5,027 | 4,982 | 4,987 | 4,951 | 4,852 | |||
| Number of delivery points – Sri Lanka | 1.41 |  |
271 | 269 | 268 | 268 | 268 | 266 | 261 | 255 | 246 | 239 | |
| Number of delivery points – Bangladesh | 20 | 20 | 19 | 19 | 19 | 19 | 19 | 19 | 18 | 18 | |||
| Number of automated teller machines | 4.61 | 948 | 934 | 921 | 906 | 885 | 850 | 775 | 677 | 640 | 625 | ||
(*) CAGR – Compound Annual Growth Rate
Group structure
Local Subsidiaries |
Local Associate |
Foreign Subsidiaries |
||||||
Commercial Development Company PLC |
CBC Tech Solutions Ltd. |
CBC Finance Limited |
Commercial Insurance Brokers (Pvt) Ltd. |
Equity Investments Lanka Limited |
Commercial Bank of Maldives Private Limited |
CBC Myanmar Microfinance Company Limited |
||
 |
 |
 |
 |
|||||
| Incorporated on | March 14, 1980 in Sri Lanka |
February 17, 2003 in Sri Lanka |
February 18, 1987 in Sri Lanka | August 17, 1987 in Sri Lanka |
August 8, 1990 in Sri Lanka |
March 24, 2015 in Maldives |
April 4, 2017 in Myanmar |
Incorporated on |
| Bank’s Holding |  90.00% 90.00% |
 100% 100% |
100% |
 60.00% 60.00% |
 22.92% 22.92% |
 55% 55% |
100% |
Bank’s Holding |
| Principal Business Activities | Property development and provision of other utility services |
Providing Information & Communication Technology (ICT) related products, services and solutions to corporate sector | Granting of leasing & hire purchase facilities, mortgage loans and other loan facilities. Accepting public deposits | Insurance Brokering | Venture Capital Financing | Banking | Microfinancing | Principal Business Activities |
| Business Address | 4th Floor, No. 8-4/2, York Arcade Building, Leyden Bastian Road, Colombo 01. | “Commercial House”, No. 21, Sir Razik Fareed Mawatha, Colombo 01. |
No. 187, Katugastota Road, Kandy. | No. 347, Dr Colvin R De Silva Mawatha, Colombo 02. | No. 108 A, 2/1, Maya Avenue, Colombo 06. | H. Filigasdhoshuge, Ameer Ahmed Magu, K. Male 20066, Maldives. |
No. 15, Office Street, Ward 4, Lewe Township, Nay Pyi Taw, Myanmar. | Business Address |
| Contact Numbers | +94 11 244 7300 | +94 11 257 4417 | +94 81 220 0272 | +94 11 760 0600 | +94 11 250 7605 +94 11 537 3745 +94 11 537 3746 | +96 0333 2668 | +95 67 80 30566 | Contact Numbers |
| Board of Directors | Board of Directors | |||||||
| Chairman | B R L Fernando | Prof A K W Jayawardane | S Muhseen | M P Jayawardena | M J C Amarasuriya | Ahmed Nazeer | K G D D Dheerasinghe | Chairman |
| Managing Director/ Chief Executive Officer |
S C U Manatunge | P K A S K Gunawardhana | G A J C S Fernando | T D Thomas | E B Sooriyaarachchi | D K S S Piyaratne | Managing Director/ Chief Executive Officer |
|
| Chief Executive Officer | R N De Silva (*) | K Mediwake (*) | M G N Dharmasiri * | A H M Riyaz | Chief Executive Officer | |||
| Director | A L Gooneratne | K D N Buddhipala | L H Munasinghe | D M D K Thilakaratne | Deshamanya S E Captain | S C U Manatunge | D J D P Hettiarachchi | Director |
| Director | A T P Edirisinghe | K S A Gamage | M P Dharmasiri | U I S Tillakawardana | J D Peiris | S Prabagar | G Sivasubramaniam | Director |
| Director | L D A Jayasinghe | N Senaratna | D M D S S Bandara | D J D P Hettiarachchi | J B Abu Baker | U I S Tillakawardana | S Prabagar | Director |
| Director | U I S Tillakawardana | S M S C Jayasuriya | W M N S K Weerapana | W I Arambage | Dr Ibrahim Vishan | Director | ||
| Director | Dr R A Attalage | L W P Indrajith | K C Vignarajah | Ms Fareeha Shareef | Director | |||
| Director | M H Wijewaradene | Ms Aishath Zahira | Director | |||||
| Director | J A D J C Nanayakkara | Director | ||||||
| Company Secretary | L W P Indrajith | M P Dharmasiri | Ms H D U O Gurnasekara | Ms Y A Kularathna | Mrs R R Dunuwille | Ms Aminath Nashadil | D K S S Piyaratne | Company Secretary |
(*) Not a Board Member
Summary of financial information
| 2023 Rs. Mn. |
2022
Rs. Mn. |
2023 Rs. Mn. |
2022
Rs. Mn. |
2023 Rs. Mn. |
2022
Rs. Mn. |
2023 Rs. Mn. |
2022
Rs. Mn. |
2023 Rs. Mn. |
2022 Rs. Mn. |
2023 Rs. Mn. |
2022 Rs. Mn. |
2023 Rs. Mn. |
2022 Rs. Mn. |
||||||||||
| Total assets | 4,326.289 | 4,055.082 | 882.140 | 626.869 | 12,457.318 | 10,955.136 | 815.258 | 758.701 | 228.063 | 254.460 | 68,306.425 | 69,661.744 | 717.423 | 602.206 | Total assets | ||||||||
| Additions to property, plant and equipment | 0.045 | 108.803 | 7.162 | 2.720 | 117.057 | 97.399 | 1.729 | 14.867 | 0.042 | – | 81.378 | 22.147 | 18.455 | 11.151 | Additions to property, plant and equipment |
||||||||
| Total liabilities | 704.817 | 637.659 | 470.910 | 82.845 | 9,481.425 | 7,777.664 | 198.906 | 191.540 | 8.558 | 28.180 | 59,267.392 | 61,350.362 | 370.828 | 182.927 | Total liabilities | ||||||||
| Net assets | 3,621.471 | 3,417.423 | 411.230 | 544.024 | 2,975.893 | 3,177.472 | 616.351 | 567.161 | 219.505 | 226.280 | 9,039.033 | 8,311.383 | 346.595 | 419.279 | Net assets | ||||||||
| Total revenue | 687.511 | 631.128 | 812.547 | 647.407 | 1,991.470 | 1,636.161 | 172.236 | 139.075 | 49.952 | 24.697 | 4,057.234 | 3,408.935 | 156.575 | 92.660 | Total revenue | ||||||||
| Profit before tax | 461.977 | 401.289 | 228.546 | 186.761 | (320.605) | 9.726 | 65.525 | 43.809 | 15.248 | (16.263) | 2,170.599 | 1,612.825 | (24.299) | (138.585) | Profit before tax | ||||||||
| Profit after tax | 294.060 | 224.377 | 173.573 | 171.724 | (225.178) | 39.583 | 43.800 | 31.349 | 15.248 | (16.263) | 1,658.421 | 1,232.231 | (24.022) | (137.619) | Profit after tax | ||||||||
| Dividend per share (Rs.) | 7.00 | 7.00 | 600.00 | 50.00 | – | – | 25.00 | 25.00 | – | – | – | – | – | – | Dividend per share (Rs.) |